Part 1: Benchmarking KV Cache, Continuous Batching, and Chunked Prefill
Once you implement a few inference optimizations, the next trap is believing they worked because the code got more complicated.
So in this post I wanted to do the annoying but necessary thing: measure them.
The toy here is intentionally tiny: a CPU NanoGPT with a 64-token context window and nonsense generations. This is not a benchmark of model quality, GPU kernels, or production serving. The question is simpler: when I add KV caching, continuous batching, and chunked prefill, do the timings move in the direction the mental model predicts?
The answer is mostly yes, but with a few useful wrinkles:
| Optimization | What I expected | What happened |
|---|---|---|
| KV cache | Faster decode by avoiding repeated attention work. | Yes. The best named case gets a 2.60x throughput speedup. |
| Continuous batching | Higher system throughput, with worse per-request latency. | Yes, but my scheduler currently under-completes some batched workloads. |
| Chunked prefill | Smoother streaming when long prompts interrupt active decode. | Sometimes. It is slower overall here, but improves worst-case decode gaps in pressure cases. |
The important thing is not that these tiny CPU numbers predict production performance. Each optimization has a shape, and a small benchmark can still tell us whether we are seeing that shape.
The Shape Of Inference
LLM inference has two phases that behave very differently:
- Prefill: read the prompt and build the initial internal state.
- Decode: generate one new token at a time.
Prefill is wide. Many prompt tokens go through the model in one shot. Decode is skinny; each request produces only one new token per step, but it repeats that step many times.
Most serving optimizations are attempts to make one of these phases less silly:
prompt tokens -> prefill -> first token -> decode -> decode -> decode -> ...
KV caching makes decode less wasteful. Continuous batching makes skinny decode steps less lonely. Chunked prefill tries to stop large prefill jobs from blocking active decode streams for too long.
For this benchmark, I intentionally ignore output quality. The model is tiny, the generations are incoherent, and everything runs on CPU. The useful signals are:
| Metric | Meaning |
|---|---|
tokens_per_s |
Generated tokens divided by wall time. Higher is better. |
wall_time_s |
Total elapsed time for the run. Lower is better. |
ttft_ms |
Time to first token in milliseconds. Lower is better, but easy to misread in this harness. |
max_gap_ms |
Worst inter-token gap. Lower means smoother streaming. |
1. KV Caching: Stop Recomputing The Past
The first optimization is KV caching. Without a cache, generation repeatedly recomputes the same past context:
step 1: run [prompt]
step 2: run [prompt, token1]
step 3: run [prompt, token1, token2]
step 4: run [prompt, token1, token2, token3]
With a KV cache, the model pays for the prompt once, stores previous keys and values, and only computes the new token’s KV entries at each decode step:
prefill: run [prompt], store KV
step 1: run [token1], append KV
step 2: run [token2], append KV
step 3: run [token3], append KV
Same generation process, much less repeated attention work.
Results
These are the main benchmark cases:
| Case | Prompt Len | Generated Tokens | No Cache Tok/s | KV Cache Tok/s | Speedup | Wall Time Reduction |
|---|---|---|---|---|---|---|
small_smoke_test |
8 | 16 | 126.67 | 185.93 | 1.47x | 31.8% |
medium_generation |
16 | 32 | 102.20 | 265.23 | 2.60x | 61.5% |
longer_generation |
16 | 48 | 143.56 | 276.58 | 1.93x | 48.1% |
heavier_prompt |
32 | 32 | 119.99 | 274.34 | 2.29x | 56.3% |
near_context_limit |
8 | 56 | 209.39 | 233.16 | 1.11x | 10.2% |
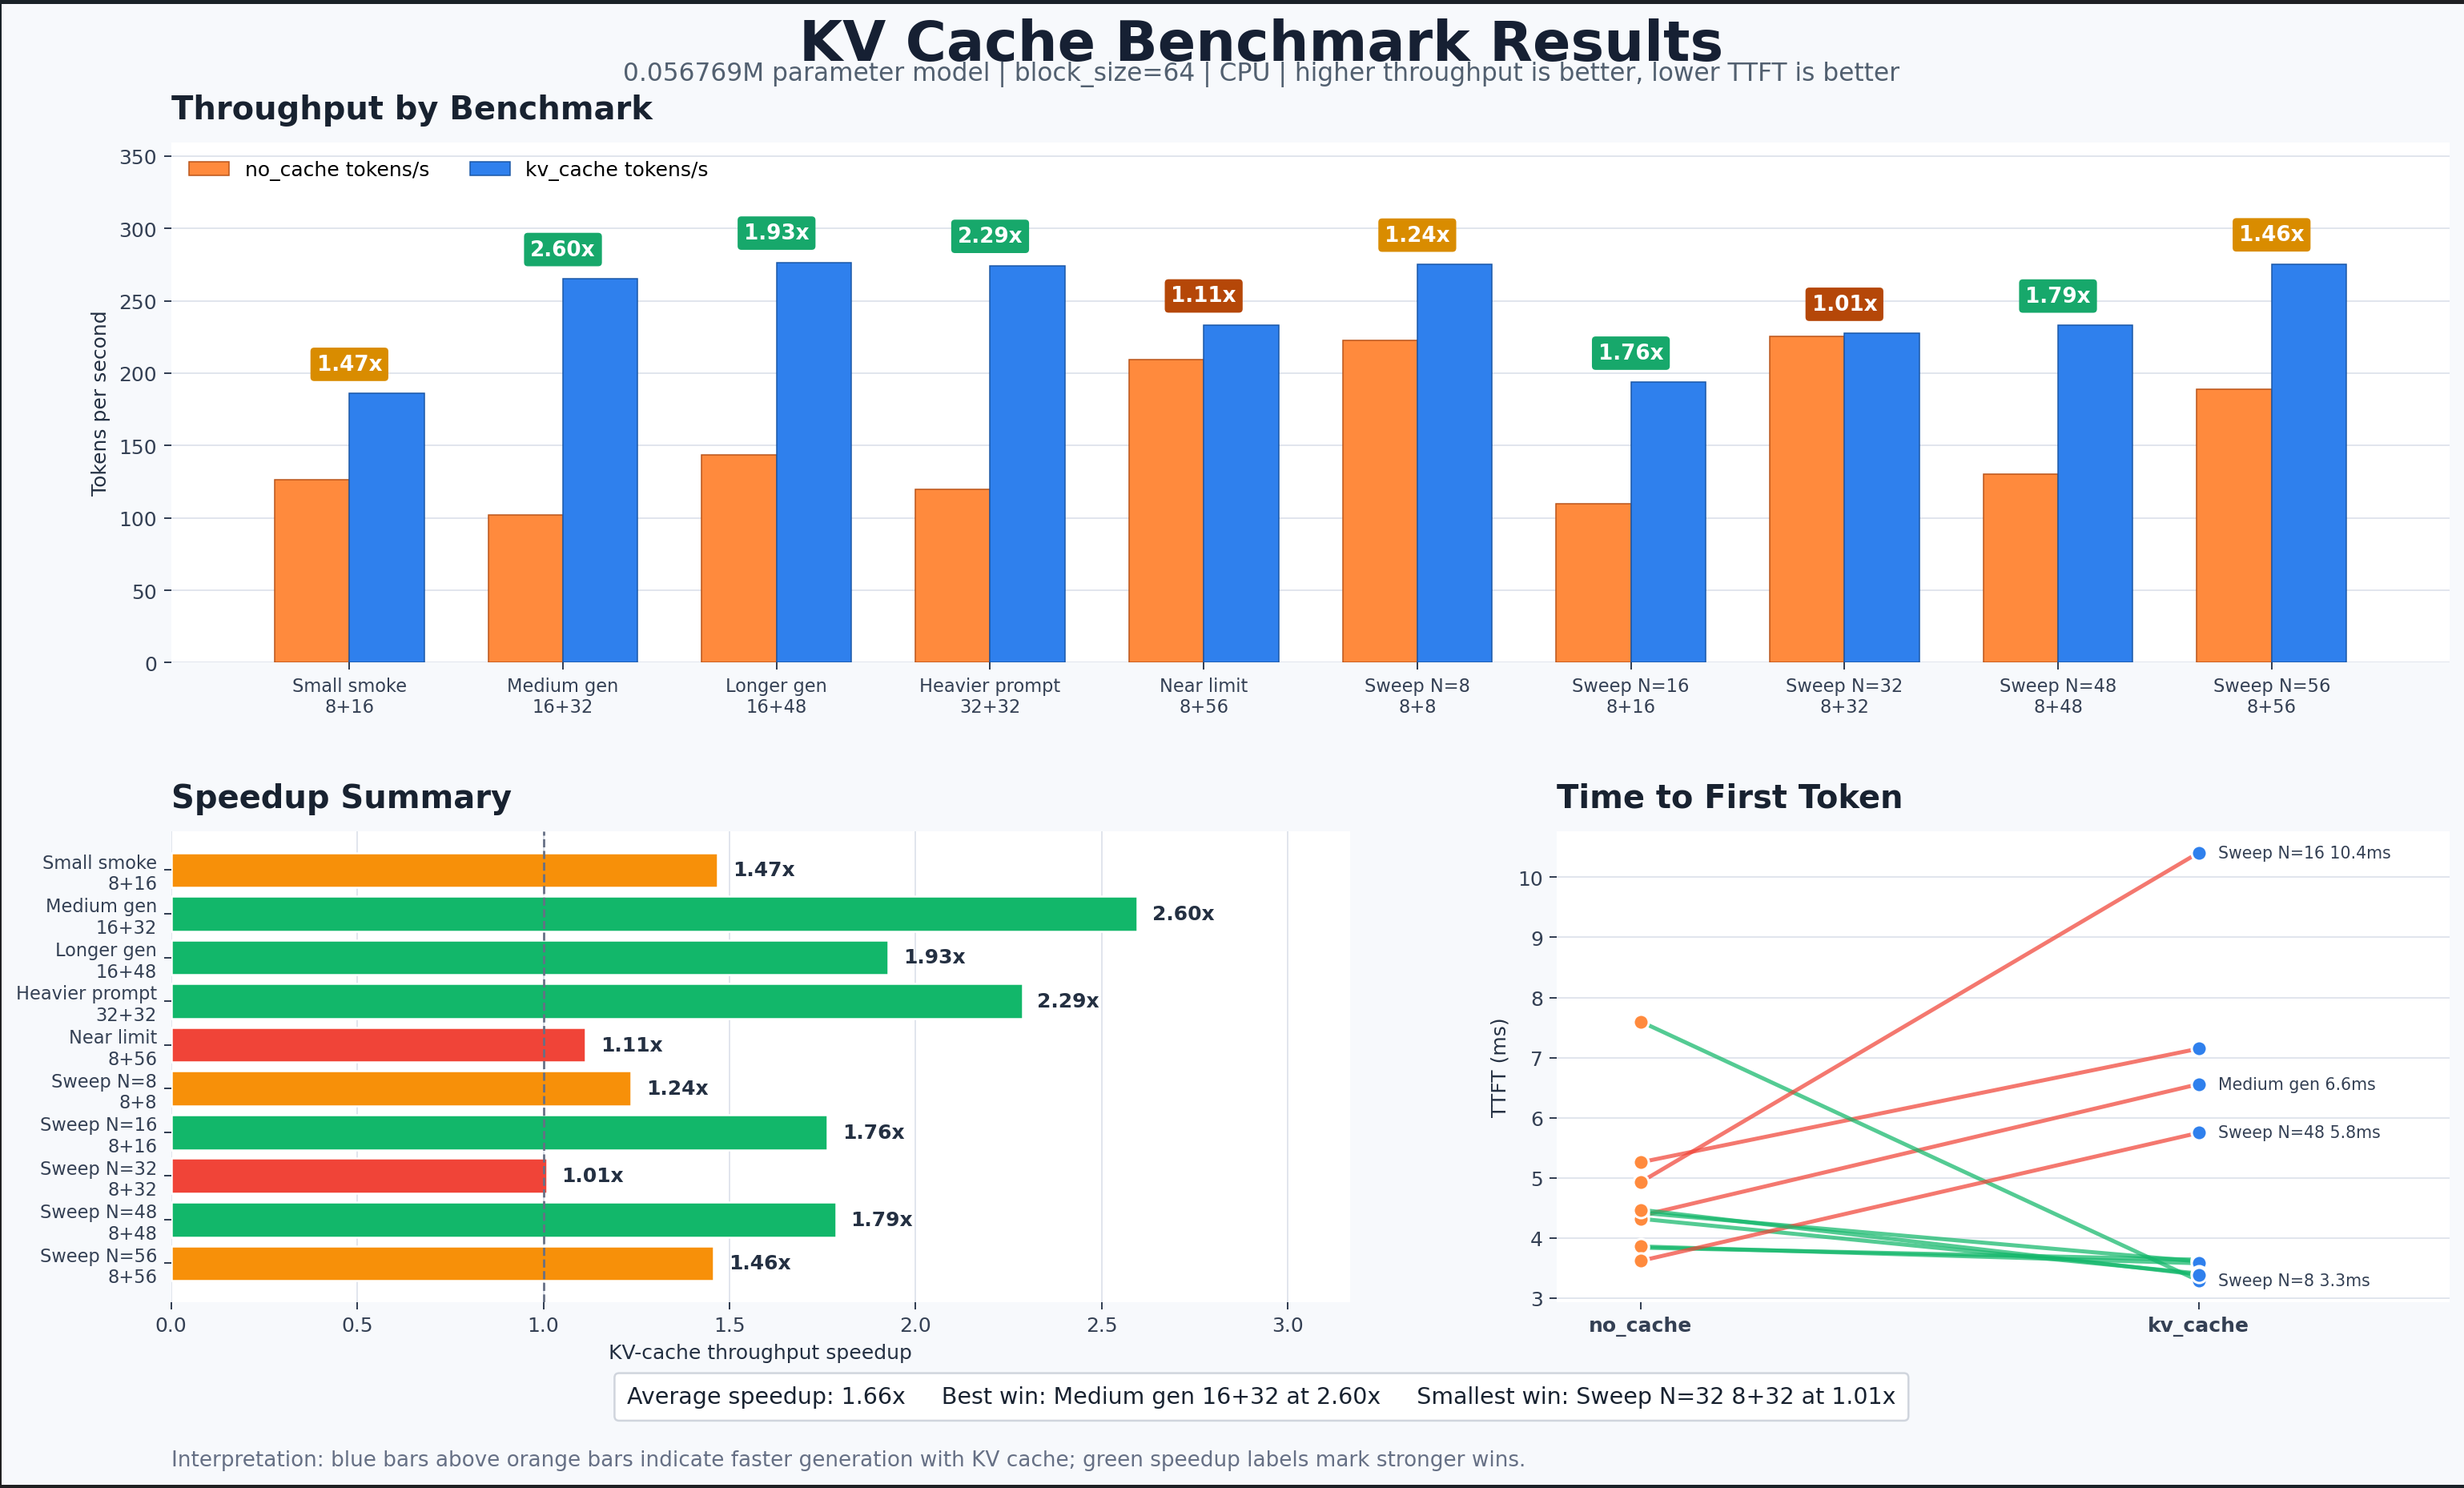
Three rows are worth staring at.
First, medium_generation is the clean win. Cached generation reaches 265.23 tokens/sec compared with 102.20 tokens/sec for the no-cache baseline. That is a 2.60x throughput improvement and cuts wall time by about 61.5%.
Second, heavier_prompt behaves exactly like the theory says it should. A longer prompt means there is more previous context to recompute at every step. The no-cache path gets 119.99 tokens/sec, while the cached path reaches 274.34 tokens/sec, giving a 2.29x speedup.
Third, near_context_limit is the interesting disappointment. It still favors KV caching, but only by 1.11x. In a pure compute model I would expect a bigger win. In this implementation, the cache grows by repeatedly appending tensors with torch.cat, which can allocate and copy as the sequence grows. The cache is saving attention work, but the naive cache storage is giving some of that time back.
Generation Length Sweep
I also fixed the prompt length at 8 tokens and varied the number of generated tokens:
| Generated Tokens | No Cache Tok/s | KV Cache Tok/s | Speedup | Wall Time Reduction |
|---|---|---|---|---|
| 8 | 222.60 | 275.18 | 1.24x | 18.9% |
| 16 | 109.83 | 193.64 | 1.76x | 43.3% |
| 32 | 225.47 | 227.41 | 1.01x | 0.8% |
| 48 | 130.52 | 233.10 | 1.79x | 44.0% |
| 56 | 188.92 | 275.38 | 1.46x | 31.4% |
The sweep mostly confirms the expected trend, but it is noisy. The weird row is N=32, where KV caching is only 1.01x faster. I do not read that as “the KV cache stopped working.” The wall times are only about 0.14 seconds, so scheduler noise, allocator behavior, Python overhead, and CPU frequency changes can move the result around.
This is a useful reminder: small CPU microbenchmarks are great for debugging intuition, but they are also very good at making tiny timing artifacts look important.
TTFT Is Not The Main Story
The TTFT results are mixed:
| Case | No Cache TTFT | KV Cache TTFT | Change |
|---|---|---|---|
small_smoke_test |
5.26 ms | 7.15 ms | KV cache slower by 1.89 ms |
medium_generation |
4.37 ms | 6.56 ms | KV cache slower by 2.19 ms |
longer_generation |
3.84 ms | 3.64 ms | KV cache faster by 0.20 ms |
heavier_prompt |
4.42 ms | 3.61 ms | KV cache faster by 0.81 ms |
near_context_limit |
3.86 ms | 3.58 ms | KV cache faster by 0.28 ms |
For a real serving system, TTFT usually decomposes into queueing delay, prefill time, and the time to sample and emit the first token. This harness does not do any model queueing, network transfer, streaming transport, or scheduler delay.
There is also a local implementation detail: the benchmark uses model.train() to force the no-cache path and model.eval() to enable the cache path. Dropout is set to 0.0, but the model still takes different attention branches. So for this particular benchmark, I trust decode throughput more than TTFT.
KV Cache Takeaways
- KV caching works in this benchmark. Every named case shows cached generation outperforming no-cache generation.
- The largest gains appear when repeated context work matters most.
medium_generationandheavier_promptboth exceed 2x speedup. - The current cache implementation is educational, not production-optimized. Appending with
torch.catis simple, but it can introduce copying overhead. - The results likely understate the importance of KV caching for real LLMs. Larger models, longer contexts, and optimized GPU kernels make recomputation much more expensive than it appears in this tiny CPU setup.
2. Continuous Batching: Throughput Is A Social Activity
Decode is skinny: one request emits one token per step. That is awkward for hardware because the model call is small, repeated, and lonely.
Continuous batching changes the shape of the work. Instead of serving each request to completion, the engine keeps a set of active requests and decodes one token for many requests in the same forward pass:
sequential:
request A: prefill, decode, decode, decode, done
request B: prefill, decode, decode, decode, done
request C: prefill, decode, decode, decode, done

continuous batching:
step 1: decode [A, B, C]
step 2: decode [A, B, C]
step 3: decode [A, B, C]
The tradeoff is immediate. System throughput can improve because every model call does more useful work. Individual latency and TTFT can get worse because requests now share the scheduler.
One important limitation: my batched scheduler currently under-completes some configured workloads. For example, a run may configure 16 requests but complete only 9 in the batched path. So the numbers below should be read as evidence that batched decode works, not as a rigorous end-to-end serving benchmark yet.
Results
| Case | Requests Configured | Max Batch | Seq Tok/s | Batched Tok/s | Speedup | Avg Lat Ratio | Avg TTFT Ratio | Batched Completion |
|---|---|---|---|---|---|---|---|---|
small_smoke_test |
8 | 4 | 271.52 | 524.11 | 1.93x | 1.37x | 1.94x | 5/8 |
more_requests_small_batch |
16 | 4 | 266.90 | 476.62 | 1.79x | 1.25x | 1.74x | 5/16 |
more_requests_larger_batch |
16 | 8 | 241.15 | 850.88 | 3.53x | 1.58x | 2.85x | 9/16 |
longer_generations |
16 | 8 | 265.04 | 956.53 | 3.61x | 1.51x | 3.98x | 9/16 |
heavier_prompt |
16 | 8 | 277.84 | 492.91 | 1.77x | 3.41x | 7.83x | 9/16 |
stress_batch_capacity |
32 | 8 | 246.66 | 671.97 | 2.72x | 1.97x | 3.21x | 9/32 |
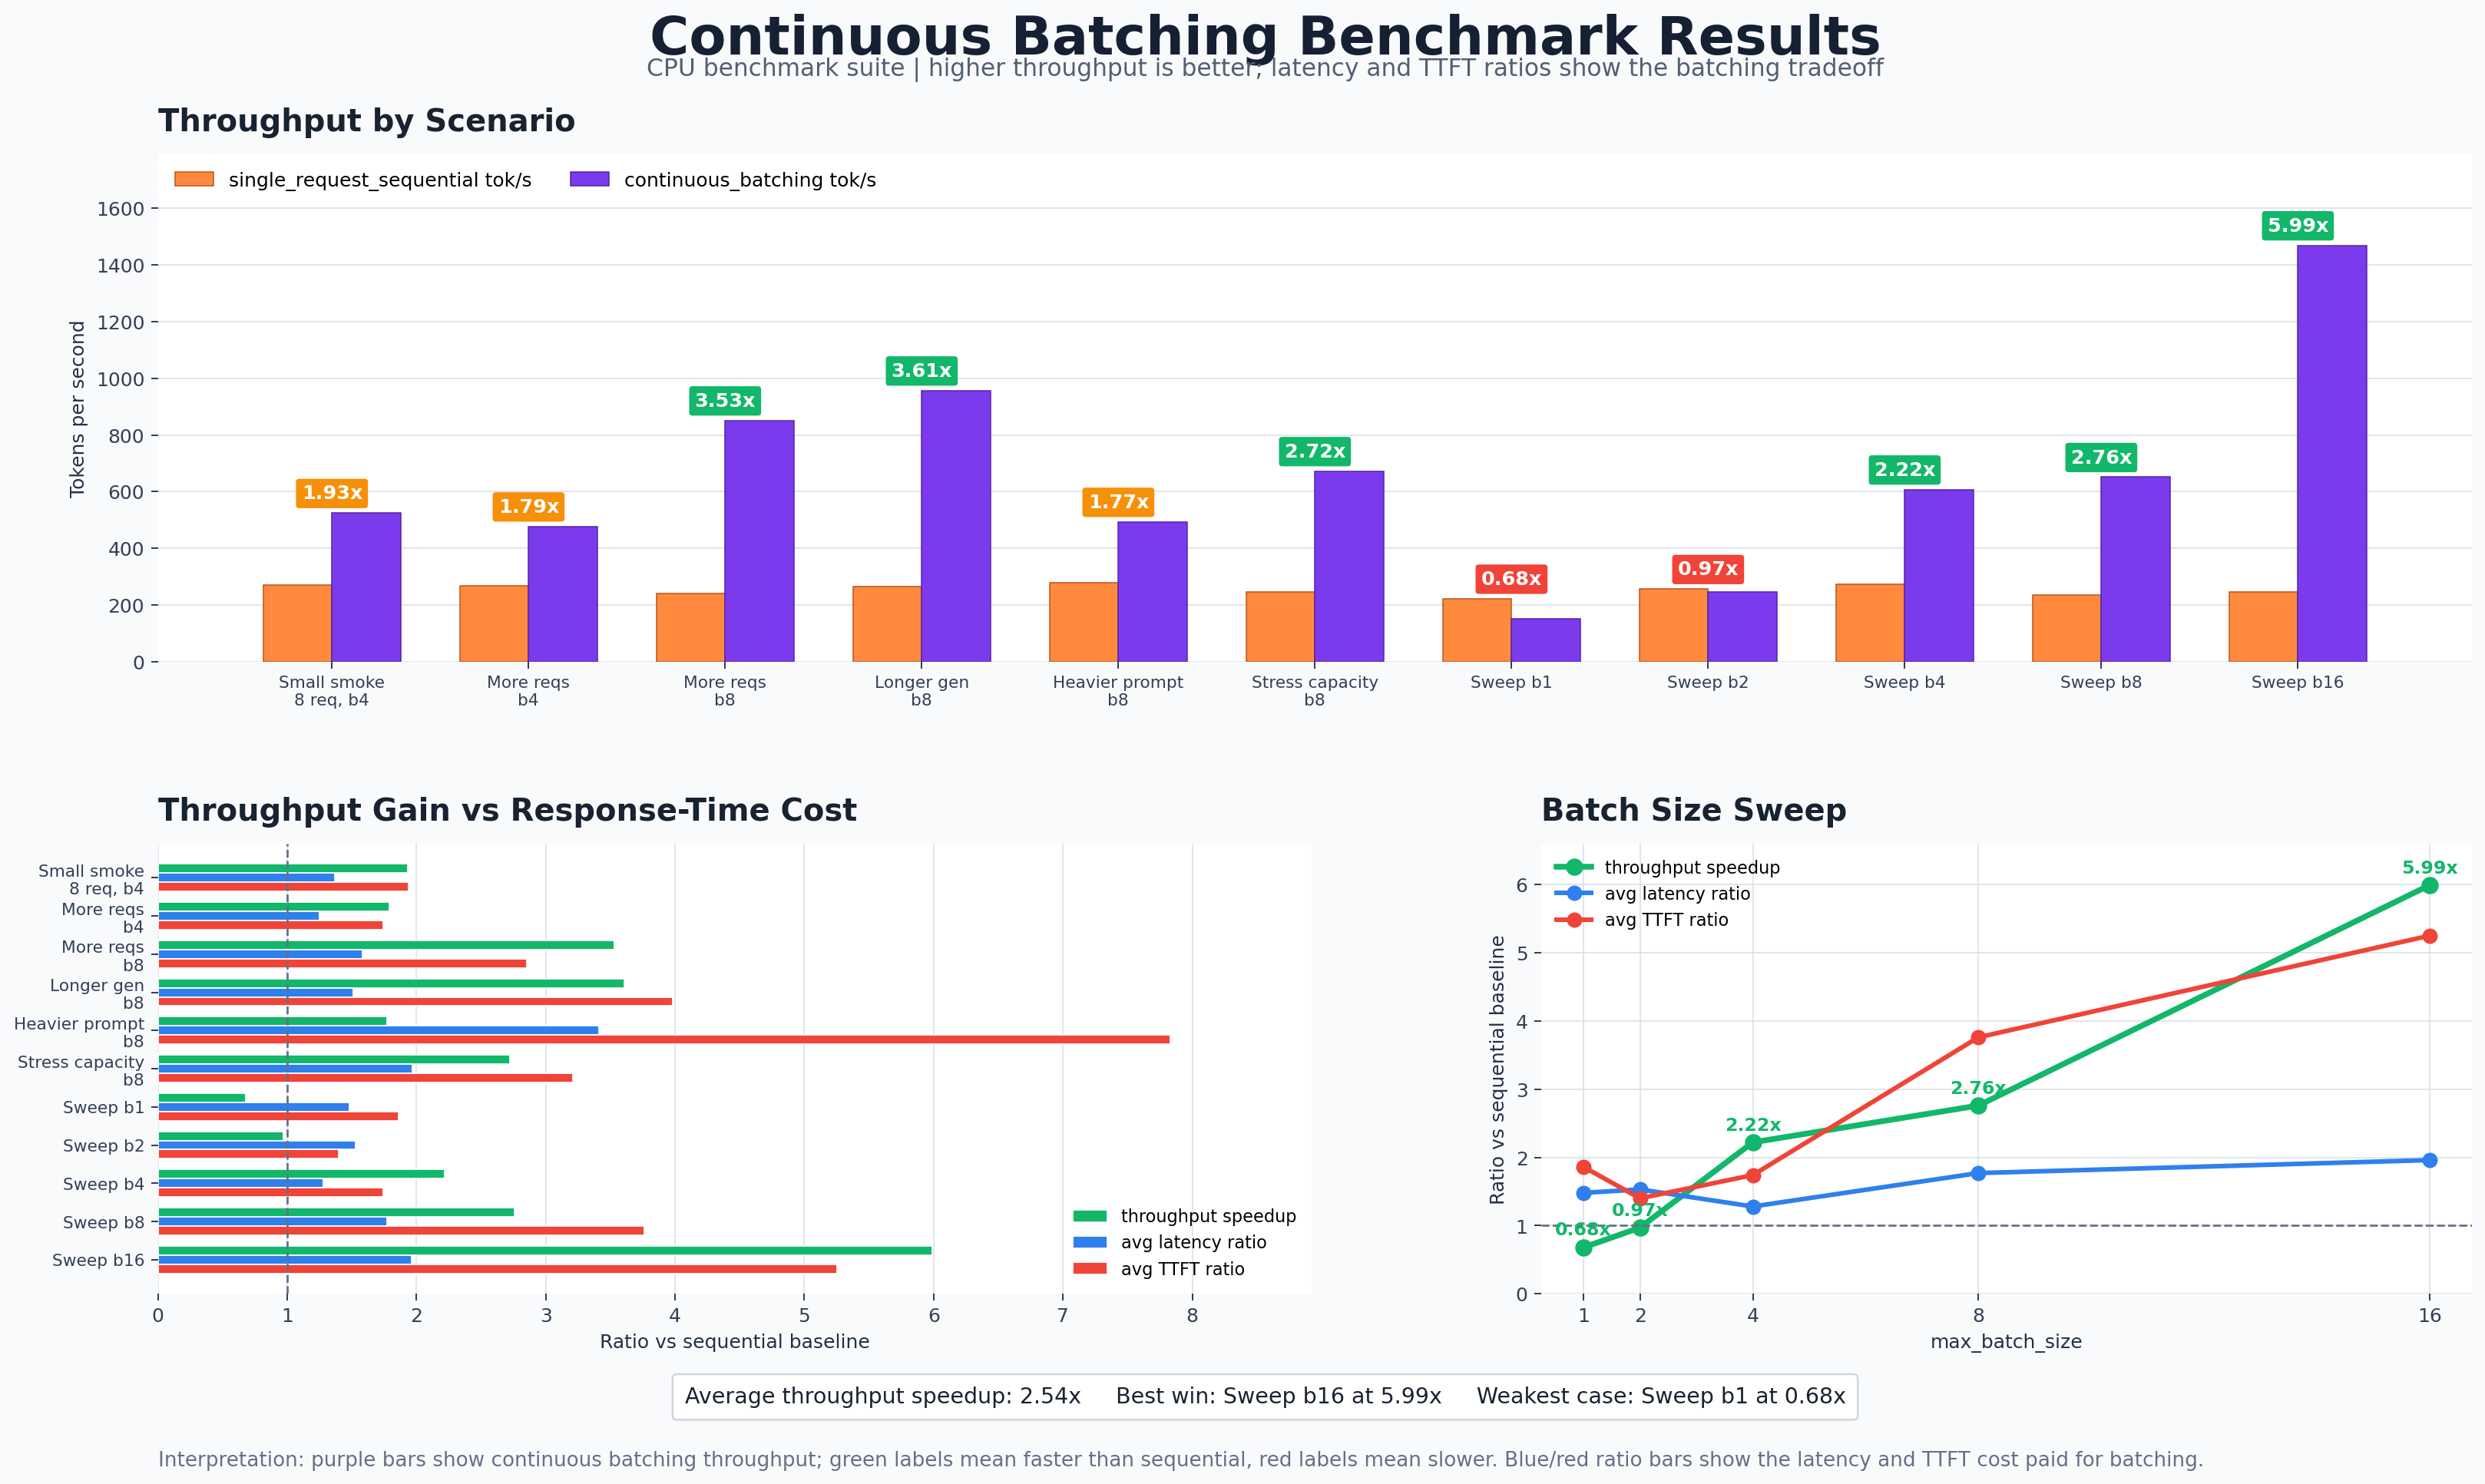
The cleanest comparison is more_requests_small_batch versus more_requests_larger_batch. Both configure 16 requests, but the max batch size increases from 4 to 8. Throughput jumps from 476.62 tokens/sec to 850.88 tokens/sec. Larger batches give the model more useful work per forward pass.
The strongest named speedup is longer_generations, where continuous batching reaches 956.53 tokens/sec versus 265.04 tokens/sec for sequential serving, a 3.61x speedup. This makes sense: longer generations create more decode steps, so the engine gets more chances to keep the active batch full.
The latency warning is heavier_prompt. Throughput still improves by 1.77x, but average TTFT rises from 5.17 ms to 40.45 ms. My scaffold handles prefill one request at a time, so heavier prompts delay first-token emission. This is the moment where prefill scheduling starts to matter.
Continuous Batching Takeaways
- Continuous batching increases throughput when the batch size is large enough. The benchmark shows a clear pattern: bigger active decode batches create more throughput.
- Batching has overhead. With tiny batches, scheduling and KV stacking can cost more than they save.
- Throughput and latency pull against each other. The engine is optimizing system-level token production, not the fastest possible single request.
- Prefill handling matters. The
heavier_promptcase motivates chunked prefill and better prefill/decode scheduling. - The scheduler needs work. The request-count mismatch must be fixed before treating these as final serving numbers.
3. Chunked Prefill: The Optimization That Gets Slower
This is the section where the “optimization” gets slower.
Normal prefill processes a prompt in one model call:
long prompt: [32 tokens] -> one prefill forward
Chunked prefill splits that same prompt into smaller pieces:
long prompt: [8 tokens] -> forward
long prompt: [8 tokens] -> forward
long prompt: [8 tokens] -> forward
long prompt: [8 tokens] -> forward
That makes prefill easier to schedule around active decode work. It also creates more forward passes, more Python overhead, more position setup, and more cache updates.
In a production serving system, chunked prefill is often paired with continuous batching. Decode tokens from many active requests can be batched together, and leftover token budget can be spent on prompt chunks. My benchmark isolates prefill scheduling and decodes active requests one at a time. That makes the overhead very visible.
Results
In these results, normal prefill is faster in every configuration. Chunked prefill reaches only 0.74x to 0.91x of normal-prefill generated-token throughput, averaging about 0.86x. It also has much worse average TTFT, ranging from 4.30x to 13.09x slower than normal prefill.
That sounds like a failure until we remember what chunked prefill is for. It is not primarily a raw-throughput optimization for tiny CPU models. It is a scheduling policy for managing interference between long prompt prefill and active decode streams.
The better reading is:
In this implementation and workload, chunked prefill trades throughput and first-token latency for slightly smoother decode gaps in some pressure cases.
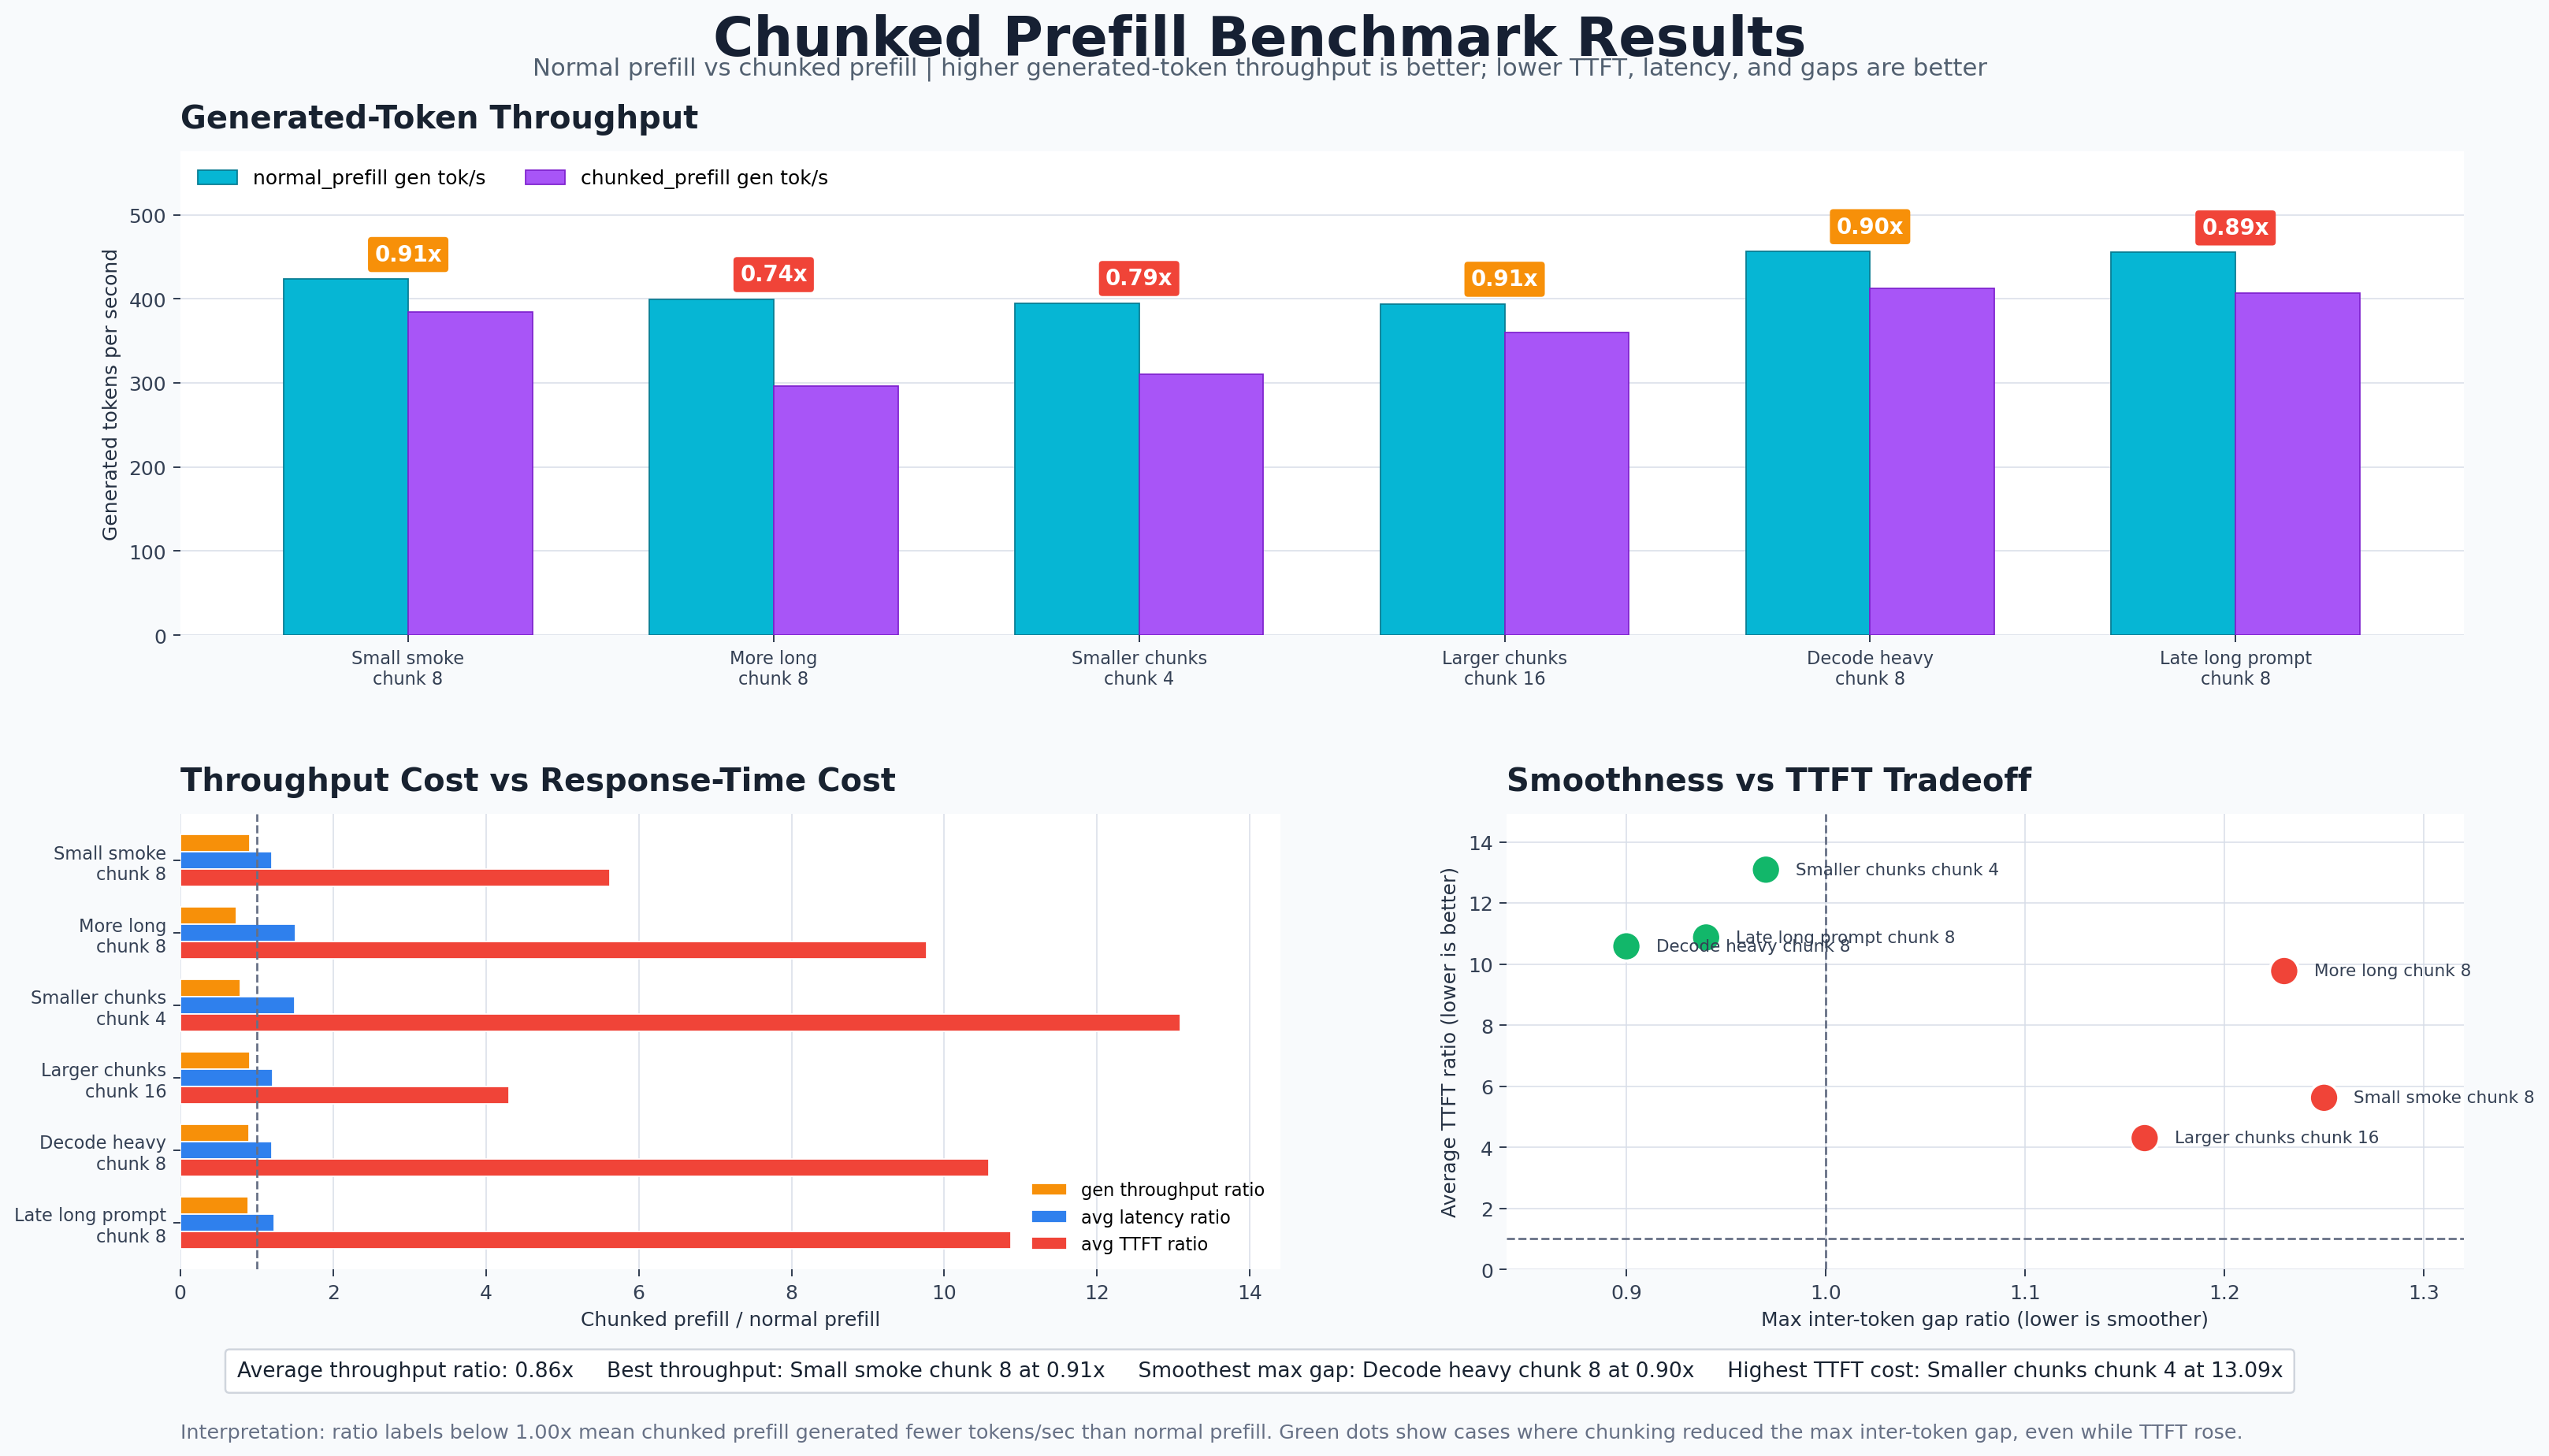
TTFT Gets Worse
The chunked policy decodes active requests first, then spends remaining token budget on prefill chunks. That protects existing streams, but new long-prompt requests may need several scheduler steps before their full prompt is processed and their first token can be emitted.
| Case | Normal Avg TTFT | Chunked Avg TTFT | Increase |
|---|---|---|---|
small_smoke_test |
6.13 ms | 34.40 ms | +28.27 ms |
more_long_prompts |
8.48 ms | 82.81 ms | +74.33 ms |
smaller_chunks_smoother_decode |
7.71 ms | 100.92 ms | +93.21 ms |
larger_chunks_less_overhead |
9.84 ms | 42.31 ms | +32.47 ms |
decode_heavy_pressure |
11.27 ms | 119.16 ms | +107.89 ms |
late_long_prompt_interruptions |
11.92 ms | 129.57 ms | +117.65 ms |
This is a real policy tradeoff: protecting existing decode streams can make newly arrived long prompts wait longer for their first token.
Streaming Smoothness Is The More Interesting Signal
Chunked prefill is meant to reduce decode interruptions. The best metric for that in this file is max_gap_ms, the worst inter-token gap.
| Case | Normal Max Gap | Chunked Max Gap | Ratio | Interpretation |
|---|---|---|---|---|
small_smoke_test |
16.10 ms | 20.09 ms | 1.25x | Chunked worse |
more_long_prompts |
24.46 ms | 29.98 ms | 1.23x | Chunked worse |
smaller_chunks_smoother_decode |
24.02 ms | 23.35 ms | 0.97x | Slightly smoother |
larger_chunks_less_overhead |
25.93 ms | 30.05 ms | 1.16x | Chunked worse |
decode_heavy_pressure |
35.75 ms | 32.25 ms | 0.90x | Smoother |
late_long_prompt_interruptions |
33.94 ms | 31.78 ms | 0.94x | Smoother |
This is where chunked prefill starts to show its intended purpose. In the decode-heavy pressure cases, chunking reduces the worst inter-token gap:
decode_heavy_pressure: max gap improves from 35.75 ms to 32.25 ms.late_long_prompt_interruptions: max gap improves from 33.94 ms to 31.78 ms.smaller_chunks_smoother_decode: max gap improves slightly from 24.02 ms to 23.35 ms.
The average gap does not improve, though. Chunked prefill has slightly higher average gaps in every row. In this benchmark, chunking mainly helps the worst stall in some pressure cases, not the overall streaming cadence.
Chunk Size Is A Knob
The clearest chunk-size comparison is between these two rows:
| Case | Chunk Size | Token Budget | Chunked Gen Tok/s | Chunked Avg TTFT | Chunked Max Gap |
|---|---|---|---|---|---|
smaller_chunks_smoother_decode |
4 | 16 | 310.58 | 100.92 ms | 23.35 ms |
larger_chunks_less_overhead |
16 | 32 | 359.99 | 42.31 ms | 30.05 ms |
Smaller chunks produce the smoothest worst-case decode gap, but they are expensive. More chunks means more forward calls, more overhead, and more scheduler steps before a long-prompt request gets its first token.
Larger chunks reduce overhead and improve TTFT, but they can create larger decode stalls because each chunk occupies a bigger piece of a scheduler step.
This is the core chunked-prefill tuning problem:
Smaller chunks protect streaming smoothness. Larger chunks protect throughput and TTFT.
The right value depends on the serving goal. A chat system may prefer smoother streaming. A batch/offline system may prefer throughput.
Chunked Prefill Takeaways
- Normal prefill wins on raw throughput in this benchmark. Chunked prefill is consistently slower, with an average generated-token throughput ratio of about 0.86x.
- Chunked prefill heavily penalizes TTFT here. Long prompts must complete multiple chunks before emitting their first token.
- Chunking can improve worst-case decode stalls in pressure cases. The max inter-token gap improves in
smaller_chunks_smoother_decode,decode_heavy_pressure, andlate_long_prompt_interruptions. - Smaller chunks are smoother but more expensive. Chunk size 4 gives the best max-gap behavior, while chunk size 16 gives better throughput and TTFT.
- This benchmark does not include the full production setting where chunked prefill shines. There is no batched decode, no GPU utilization pressure, no large model, and no very long context.
Where This Leaves Us
The small CPU setup is not production-like, but it did its job. KV caching clearly removes repeated work. Continuous batching shows the throughput/latency tradeoff, even with a scheduler limitation still visible in the results. Chunked prefill is the most subtle: it is not automatically faster, but it gives the scheduler another knob for protecting decode smoothness.
Appendix: Raw KV Cache Benchmark Sample
Here is a small excerpt from the KV-cache benchmark log. The full logs live with the benchmark code in the repo.
0.056769 M parameters
block_size=64, device=cpu

=== medium_generation ===
{'prompt_len': 16, 'N': 32}
method   | tokens | wall_time_s | tokens_per_s | ttft_ms
---------+--------+-------------+--------------+--------
no_cache | 32     | 0.3131      | 102.20       | 4.37
kv_cache | 32     | 0.1206      | 265.23       | 6.56

KV-cache throughput speedup: 2.60x

=== heavier_prompt ===
{'prompt_len': 32, 'N': 32}
method   | tokens | wall_time_s | tokens_per_s | ttft_ms
---------+--------+-------------+--------------+--------
no_cache | 32     | 0.2667      | 119.99       | 4.42
kv_cache | 32     | 0.1166      | 274.34       | 3.61

KV-cache throughput speedup: 2.29x
For the full testing code, refer to https://github.com/czhou578/multimodal-inference-visualizer/tree/main/benchmarks
CZ