Developing my own Benchmark! Part 1
In this post, I would like to explain how I was able to create my own custom benchmark for personal open source model testing. This will be a multi-part series focused on my benchmarking journey. It was a bunch of twists and turns in order to produce something comprehensive on both hardware and software wise.
Since I got my DGX Spark, I’ve been downloading and trying out various open source models on my machine, but testing each one out of the box is time intensive and can waste a lot of time. My coding workflows are quite diverse and it can be difficult to accurately measure the true performance in terms of hardware utilization and decode speed from just blind testing.
This is why I decided to invest in building my own testing harness that takes inspiration from other benchmarks out there.
Folder and Architecture
I did long sessions with ChatGPT and other cloud LLM’s to map out an ideal architecture and folder structure for my benchmarking harness.
Eventually, I settled on this:
High-level Architecture
benchmark-suite/
│
├── models/
│   ├── qwen3-35b.yaml
│   ├── llama4.yaml
│   └── ...
│
├── benchmarks/
│   ├── latency/
│   ├── coding/
│   ├── reasoning/
│   ├── swe/
│   ├── hle/
│   └── system/
│
├── datasets/
│   ├── humaneval/
│   ├── mbpp/
│   ├── swebench/
│   ├── hle/
│   └── prompts/
│
├── runners/
│   ├── vllm_runner.py
│   ├── llama_runner.py
│   ├── sglang_runner.py
│   └── api_runner.py
│
├── metrics/
│   ├── latency.py
│   ├── memory.py
│   ├── power.py
│   ├── code.py
│   └── reasoning.py
│
├── reports/
│
└── benchmark.py
The benchmarking will be driven by config (.yaml) files. The yaml files will define the model name, metadata, testing prompt lengths, and the actual prompts that are going to be launched. The goal of doing this is to make it as model agnostic as possible.
If there is a new model that needs to be added, it is just one config file and run the benchmark.py file. The results of the run will populate a subfolder in the results/ folder with a collection of .json files that contain the metrics.
What To Measure
The following metrics need to be measured for our benchmark:
First-token latency (TTFT)
- This is defined as the time between
POST /generateandfirst generated token. We are going to use multiple prompt lengths from 32 to 16384 tokens. We want a final graph between prompt length and latency. This will reveal the KV-cache behavior.
Decode speed
- This is the easiest benchmark. We generate 512, 1024, and 2048 tokens, and record the average tok/sec, peak tok/sec, minimum tok/sec, median tok/sec.
Prompt processing speed
- This is defined as
Input tokens / prefill timeto give tokens/sec. We will use prompt sizes of 128 to 32768 tokens, and graph the prompt size against the prefill throughput.
Reasoning token count
- Many reasoning models generate thinking tokens along the lines of
<thinking> </thinking>. We want to measure the ratio of these thinking tokens to the actual answer tokens. We will also want to measure the maximum, median, and the average thinking length.
This tells you whether newer models reason more efficiently.
Memory usage
We record GPU memory, GPU utilization, temperature, and clocks from nvidia-smi every second, along with CPU RAM and swap usage. The data is stored as a CSV and then plotted as memory usage over time, giving us a continuous view of how the model and hardware interact during inference.
Power consumption
We use nvidia-smi --query-gpu=power.draw every second to collect average watts, peak watts, energy (Wh), and energy per token. This is an underrated benchmark — a model producing 60 tok/sec at 120W is much more efficient than one producing 75 tok/sec at 300W. We want a way to measure how fast the models can respond with tokens while also measuring the backend performance and hardware utilization. Ideally, it will give us a bigger picture of how the hardware and software are coexisting together within this system.
We also have to make sure we standardize the environment, which includes the CUDA version, PyTorch version, CPU, RAM, GPU, etc. Benchmarks are supposed to be replicable and having constantly changing hardware would make running them useless.
Future Work
Once the core suite is stable, there are several metrics that would make it stand out from existing benchmarks:
- Time-to-first-correct-answer: Combine latency and accuracy by measuring how long it takes a model to produce its first correct solution.
- Energy efficiency: Report joules per generated token and joules per solved benchmark task, not just average watts.
- Long-context performance: Measure throughput, latency, and accuracy as prompt lengths grow from a few thousand tokens to the model’s maximum context window.
- Concurrency and serving scalability: Benchmark throughput and latency with multiple simultaneous requests to evaluate serving efficiency.
- Determinism and stability: Run the same prompt repeatedly (especially at temperature 0) and quantify output consistency.
- Cost modeling: Even for local inference, estimate GPU-hours, energy cost, and tokens per dollar-equivalent to compare models fairly.
- Structured output reliability: Test JSON/function-calling success rates and schema adherence for agentic workflows.
- Vision and multimodal benchmarks: If you evaluate multimodal models later, add OCR, chart understanding, image reasoning, and visual question answering.
- Regression tracking: Automatically compare each run against previous versions and highlight statistically significant improvements or regressions.
This roadmap results in a benchmark suite that measures three complementary dimensions:
- Performance: latency, throughput, memory usage, power, scalability.
- Capability: coding, software engineering, reasoning, knowledge, long-context tasks.
- Efficiency: reasoning token count, energy per token, and energy per solved task.
Core Runner File
The heart of the benchmark suite is runner.py — a Phase 1 core benchmark runner designed specifically for GPU-bound single-node inference tuning, like running vLLM on a DGX Spark. It’s intentionally trimmed down from a full harness: it drops host CPU/RAM/swap tracking, GPU clock sampling, and verbose platform metadata in favor of the metrics that actually matter for inference performance.
Environment fingerprinting. Before any benchmark runs, the script snapshots the hardware and software environment — GPU name, driver version, CUDA version (via nvcc --version), and the installed versions of torch and vllm. This ensures every run is reproducible and comparable, since benchmark results are meaningless if the underlying software stack keeps changing.
Token counting and prompt construction. The script uses tiktoken with the cl100k_base encoding as a fallback for token counting when the server doesn’t return usage stats in its response. More importantly, it includes a clever build_prompt_of_length() function that constructs substantive, non-repetitive prompts at any target token length. Instead of repeating a pangram (which causes models to produce meta-commentary and hit a ~500-token wall), it weaves together multiple creative-writing blocks about various topics.
GPU Resource Monitor. A background thread samples GPU memory usage and power draw at 1 Hz using nvidia-smi. Every sample is stored as a row in a CSV file for later plotting. When the benchmark finishes, it computes summary statistics: average and peak GPU power (watts), average and peak memory usage (MiB), and total energy consumption (watt-hours). This gives us a continuous view of how the model and hardware interact during inference.
Model Client. The ModelClient class implements an OpenAI-compatible streaming client that handles both chat and completions endpoints. Its wait_until_ready() method performs a two-step readiness check: first it polls /v1/models until the HTTP server accepts connections, then it drives a real test request to confirm the model engine has actually loaded its weights from disk. This second step is critical because the server can be listening long before the model is ready to process requests. Otherwise, latency sweeps would fire against a still-initializing engine and every TTFT measurement would show n=0.
The generate() method streams tokens and tracks several things simultaneously: time-to-first-token (TTFT), per-token time gaps, and accumulates reasoning tokens and answer tokens separately by inspecting delta.reasoning and delta.content in the streaming response (very important!). This split enables accurate reasoning-token analysis for models like Qwen3 that emit thinking tokens before their final answer.
Latency sweep. The run_latency_sweep() function measures TTFT across multiple prompt lengths (configurable, defaulting from 32 to 16384 tokens), repeating each measurement multiple times to account for variance. For each prompt length, it records average, median, p95, and p99 TTFT, plus prefill throughput (prompt tokens divided by prefill time). This produces the data for a KV-cache behavior graph, showing how prompt length affects first-token latency.
Decode speed benchmark. run_decode_speed() generates 512, 1024, and 2048 tokens from a fixed-length prompt and records average, peak, minimum, and median token-per-second rates. It also analyzes the reasoning-to-answer token ratio by using the pre-split reasoning/answer text from the streaming response (for models that support it natively) or falling back to a heuristic parser that handles three formats: Qwen3-style <antThinking> XML tags, Anthropic-style <thinking> tags, and plain-text reasoning markers like “let me think” or “step by step”.
Reasoning token benchmark. run_reasoning_benchmark() takes a list of reasoning-oriented prompts (e.g., “If a train travels 60 miles in 45 minutes, what is its speed in mph?”) and measures how many tokens each model spends on thinking versus answering. It reports averages, maximums, and medians for both thinking tokens and answer tokens, plus the ratio between them — giving a concrete way to evaluate whether newer models reason more efficiently.
Plugin system. The script includes a register_benchmark() decorator that future phases can hook into. When a function is registered under a name like "code_correctness" or "swe", it automatically gets called during the main orchestration loop and its results are saved alongside the core metrics. This makes the harness extensible without modifying the core runner.
Orchestration. The main() function ties everything together: it loads a model config YAML, creates a timestamped run directory under results/<model>/<timestamp>/, fingerprints the environment, waits for the model endpoint to be ready, starts the GPU monitor, runs each benchmark phase (latency, decode, reasoning, and optionally concurrency), invokes any registered plugin benchmarks, stops the monitor, and writes a comprehensive summary.json with every metric. It also computes energy_per_token — dividing total GPU energy (Wh) by total output tokens across the decode benchmarks — giving a direct efficiency comparison between models.
Concurrency File
Beyond single-request benchmarks, we also need to understand how performance degrades under concurrent load — after all, production inference rarely serves one request at a time. The concurrency.py file measures exactly this: how aggregate throughput and per-request latency change when you fire multiple requests simultaneously.
Purpose and approach. The core question is straightforward: how does aggregate throughput change when I send 1, 4, 16, or 32 requests at the same instant? At what concurrency level does the GPU become the bottleneck? To answer this, run_concurrency_test() takes a list of concurrency levels (default [1, 2, 4, 8, 16]) and fires requests_per_level requests at each level using Python’s ThreadPoolExecutor, with max_workers set to the concurrency level. All requests share the same 256-token creative-writing prompt at temperature 0, keeping the comparison deterministic.
Per-request tracking. Each individual request returns a ConcurrentRequestResult dataclass with success/failure status, prompt and output token counts, TTFT, total request time, and any error message. If a request fails (e.g., the server rejects it under load), the error is captured rather than letting the whole batch crash — failures are tallied separately in the final output so we can see whether a concurrency level pushes the engine past its breaking point.
Aggregate metrics. After all requests in a batch complete, the script computes wall time, total output tokens, aggregate throughput (tok/s), and success rate. It then produces a full statistical summary of TTFT and total latency across successful requests: average, median, p95, min, and max. The per-concurrency-level output also includes a detailed breakdown of every individual request — its index, success flag, token counts, TTFT, and total time — making it easy to spot outliers or request-level failures that the aggregate numbers might hide.
Integration with the core runner. concurrency.py is imported lazily by core_runner.py inside the main orchestration loop (via from benchmarks.concurrency import run_concurrency_test). The lazy import ensures the concurrency module is only loaded when the user hasn’t passed --skip-concurrency. Its results are saved to a concurrency.json file alongside the latency, decode, and reasoning results, giving a complete picture of serving scalability for each model tested.
Running Results for Qwen RedHat.
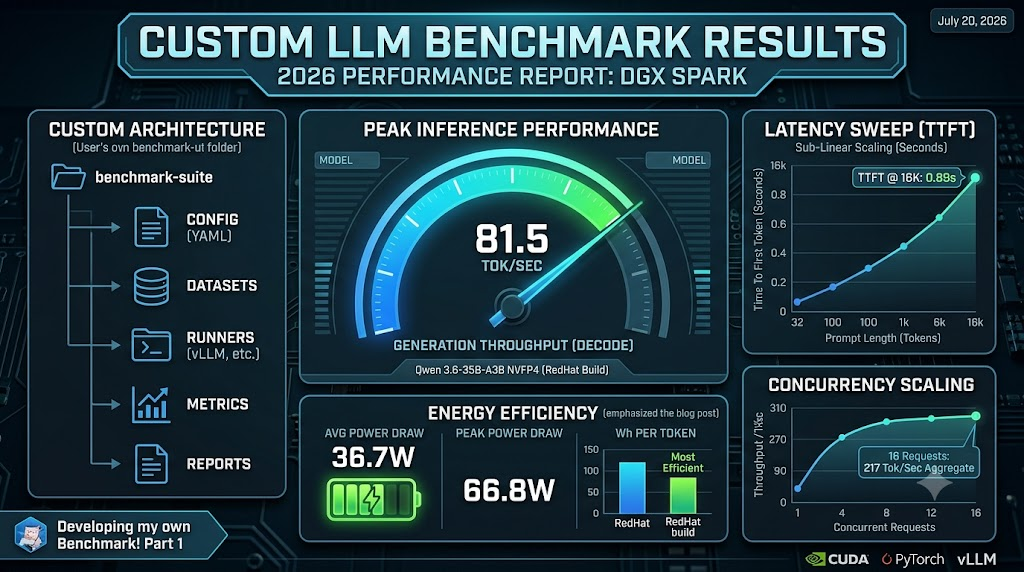
I tried to run the entire test for the RedHat version of Qwen, which is my daily driver. I used the config file:
name: qwen3.6-35b-a3b-redhat-test-nvfp4
endpoint:
  base_url: "http://127.0.0.1:8000"
  model_name: "qwen3.6-35b-a3b-nvfp4"
  chat: true
ready_timeout_s: 600
monitor_interval_s: 1.0
prompt_lengths: [32, 128, 512, 2048, 8192, 16384]
latency_repeats: 10          # bump toward 100 once runtime is validated
decode_lengths: [512, 1024, 2048]
reasoning_prompts:
  # --- Baseline: existing prompts (soft reasoning request, no explicit CoT trigger) ---
  - "Solve: if a train travels 60 miles in 45 minutes, what is its speed in mph? Show your reasoning."
  - "A farmer has 17 sheep, all but 9 die. How many are left? Explain your reasoning step by step."
  # --- CoT-triggering: explicit <antThinking> block to activate Qwen3 reasoning mode ---
  - |
    <antThinking>
    I'll work through this problem step by step.
    </antThinking>
    Solve: if a train travels 60 miles in 45 minutes, what is its speed in mph?
  - |
    <antThinking>
    Let me think through this carefully.
    </antThinking>
    A farmer has 17 sheep, all but 9 die. How many are left?
  # --- Harder CoT: multi-step reasoning puzzles ---
  - |
    <antThinking>
    Let me break this down systematically.
    </antThinking>
    A bag contains 3 red marbles and 5 blue marbles. If you draw two marbles without replacement, what is the probability that both are blue? Show each step of your calculation.
  - |
    <antThinking>
    I need to analyze this problem step by step.
    </antThinking>
    Write a Python function that finds the longest palindromic substring in a given string. Explain your algorithm choice and trace through an example like "babad" or "cbbd".
# --- Concurrency benchmark ---
concurrency_levels: [1, 2, 4, 8, 16]
concurrency_requests_per_level: 5
concurrency_max_tokens: 256
concurrency_temperature: 0.0
This is a model configuration YAML for the benchmark suite. It defines:
Model identity: qwen3.6-35b-a3b-redhat-test-nvfp4 served at http://127.0.0.1:8000 via the chat endpoint.
Latency sweep: Prompt lengths from 32 to 16384 tokens, with 10 repeats each (noted to bump toward 100 once validated).
Decode speed: Output lengths of 512, 1024, and 2048 tokens.
Reasoning prompts: Six prompts split into three categories — baseline soft-reasoning questions (train speed, sheep puzzle), explicit
Concurrency benchmark: Levels 1, 2, 4, 8, 16 with 5 requests each at 256 output tokens, temperature 0. The ready_timeout_s: 600 and monitor_interval_s: 1.0 are operational settings for engine readiness and GPU sampling.
I ran this and the summary.json file showed the following results across all benchmark phases:
Latency (TTFT) and Prefill Throughput
| Prompt Length | Avg TTFT | Prefill Throughput |
|---|---|---|
| 32 tokens | 0.1470 s | 305.8 tok/s |
| 128 tokens | 0.1514 s | 911.7 tok/s |
| 512 tokens | 0.1942 s | 2,688.8 tok/s |
| 2,048 tokens | 0.3853 s | 5,341.4 tok/s |
| 8,192 tokens | 0.7660 s | 11,095.6 tok/s |
| 16,384 tokens | 0.8937 s | 20,355.0 tok/s |
TTFT scales sub-linearly with prompt length — a 512× increase in tokens (32 → 16,384) only produces a ~6× increase in latency (0.147 s → 0.894 s). This is excellent KV-cache behavior. Prefill throughput scales beautifully from 305 tok/s at 32 tokens to over 20,000 tok/s at 16,384, showing that the attention engine efficiently processes larger batches of prompt tokens. The tail latency at 8,192 and 16,384 tokens shows some variance (p99 of 1.26 s and 2.03 s respectively), suggesting occasional scheduling hiccups under heavy prefill loads.
Decode Speed
Across all output lengths, decode speed is remarkably consistent:
- 512 output tokens: 54.83 tok/s over 9.34 seconds
- 1,024 output tokens: 52.91 tok/s over 19.35 seconds
- 2,048 output tokens: 52.57 tok/s over 38.96 seconds
The model maintains ~52–55 tok/s regardless of generation length, with no measurable degradation at longer outputs. This indicates the decode stage is purely memory-bandwidth-bound and scales linearly with token count.
Reasoning Token Analysis
The benchmark reveals interesting behavior across prompt types:
| Prompt Type | Thinking Tokens | Answer Tokens | Ratio |
|---|---|---|---|
| Baseline (train speed) | 521 | 135 | 3.86× |
| Baseline (sheep puzzle) | 564 | 164 | 3.44× |
<antThinking> trigger (train) |
495 | 74 | 6.69× |
<antThinking> trigger (sheep) |
317 | 34 | 9.32× |
| Harder CoT (probability) | 963 | 0 | ∞ (token budget exhausted) |
| Harder CoT (palindrome) | 977 | 0 | ∞ (token budget exhausted) |
Baseline prompts produce 3–4× thinking-to-answer ratios. Adding explicit <antThinking> reasoning-mode tags inflates the ratio to 6–9×. The model spends proportionally much more on reasoning scaffolding than on the final answer. The harder multi-step problems (probability calculation, palindrome coding) exhaust the 1,024-token output budget before producing any answer tokens, suggesting these reasoning models need significantly more output tokens for complex tasks.
Concurrency Scaling
| Concurrency | Wall Time | Aggregate Throughput | Avg TTFT | Success Rate |
|---|---|---|---|---|
| 1 | 18.48 s | 69.3 tok/s | 0.168 s | 100% |
| 2 | 11.98 s | 106.9 tok/s | 0.262 s | 100% |
| 4 | 8.26 s | 155.0 tok/s | 0.316 s | 100% |
| 8 | 5.63 s | 227.4 tok/s | 0.381 s | 100% |
| 16 | 5.88 s | 217.8 tok/s | 0.373 s | 100% |
Throughput scales near-linearly from 1 to 8 concurrent requests (69 → 227 tok/s), but plateaus at 16 concurrency where throughput actually drops slightly (227 → 217 tok/s) — the GPU is fully saturated. TTFT degrades gracefully from 0.168 s to 0.381 s (2.3× increase across 16× concurrency). All requests succeeded at every level, indicating the vLLM engine handles concurrent load without failures.
GPU Power and Efficiency
- Average power draw: 36.7 W
- Peak power draw: 66.8 W
- Total energy consumed: 2.09 Wh over 205 seconds of sampling
- Energy per token: 0.000583 Wh/token
The DGX Spark’s GPU draws remarkably low power during inference , averaging only 36.7 W with brief peaks at 66.8 W. At ~53 tok/s and ~0.00058 Wh per token, this model is exceptionally energy-efficient, making it ideal for always-on or battery-conscious deployments.
Running Against Other Models
I decided to run this against the other Qwen versions; the Nvidia released NVFP4 version and the Unsloth quantized NVFP4 version as well.
The full file to the results are here.
Three-Model Comparison
I extended the harness to compare three NVFP4-quantized Qwen3.6 models on the same DGX Spark: the NVIDIA official build, the Red Hat build, and the Unsloth quantized version. The full results are in the benchmark report.
Decode speed. NVIDIA’s official build is the clear winner, delivering ~174 tok/s — more than 3× the ~52–55 tok/s that the Red Hat build achieves. Unsloth also trails at decode.
Latency and prefill. Unsloth wins at short inputs with a 63 ms TTFT at 32 tokens. Red Hat matches NVIDIA’s prefill efficiency at long prompts (~893 ms TTFT at 16K). Around 2K tokens, prefill metrics from all three models converge, reinforcing that prefill is not the bottleneck for sustained workloads.
Concurrency. NVIDIA’s build scales to ~350 tok/s at batch 8, roughly 2× the Red Hat build’s ~155 tok/s at the same level. Unsloth’s concurrency profile follows a similar pattern to its decode: competitive at low batch, falling behind under load.
Energy efficiency. NVIDIA leads at 0.00033 Wh/token which is notably better than the Red Hat build’s 0.00058 Wh/token.
Reasoning. Here the data reveals a trade-off: NVIDIA’s build, despite its raw speed, has a functional correctness gap in reasoning benchmarks, while Red Hat produces consistent, usable outputs. Unsloth is best reserved for low-latency, short-context tasks where fast responses matter more than depth.
The TLDR is that no single build wins in every category: NVIDIA for speed, Red Hat for stability, Unsloth for short-context latency.
Running 3rd Party Benchmarks
I initially planned to benchmark against HumanEval, Datacurve’s DeepSWE and other 3rd party benchmark suites. But I eventually didn’t do any of that for the following reasons:
- For DeepSWE, the entire benchmark suite was designed for linux/amd64 architectures. It meant that when I tried to run it on my DGX Spark, it immediately encountered compilation issues due to all the dependencies in the suits being built only for that type of machine.
After trying to fix the issue with using Docker’s buildx plugin that automatically rebuilds images in a any architecture, I abandoned the effort due to it increasing the cost of running all the benchmarks.
- Humanity’s Last Exam also didn’t work since my Qwen model that I was testing wasn’t able to adequately complete the testing suites without giving back nonsensical answers. I was running about 4 tests at one time (since the whole benchmarking suite takes about a day to run) and my model wouldn’t give back 4 responses for the 4 prompts. I have yet to fully debug this and figure out why.
Let me know how you are benchmarking local open source models! The entire repo can be found here:. I will be writing up more parts of this series in the future, so stay tuned!
CZ