Developing my own Benchmark Pt. 3 (Prefill Scaling)
In this post, I walk through the prefill scaling benchmark — one of the three benchmarking tools I’ve built to measure LLM inference performance.
The goal is straightforward: measure how fast a model processes the prompt (the prefill stage) across a range of input lengths. Specifically, we want to know how prefill throughput (tokens processed per second) changes as the prompt grows. If the implementation scales linearly, throughput should stay flat. A steep slope signals a problem.
To do this accurately, we need to hit exact token lengths: measuring “8K-token prompts” rather than “roughly 8K-ish prompts.” Since subword tokenizers don’t split at byte boundaries, the benchmark includes a calibration pipeline to find the exact character prefix that produces any target count.
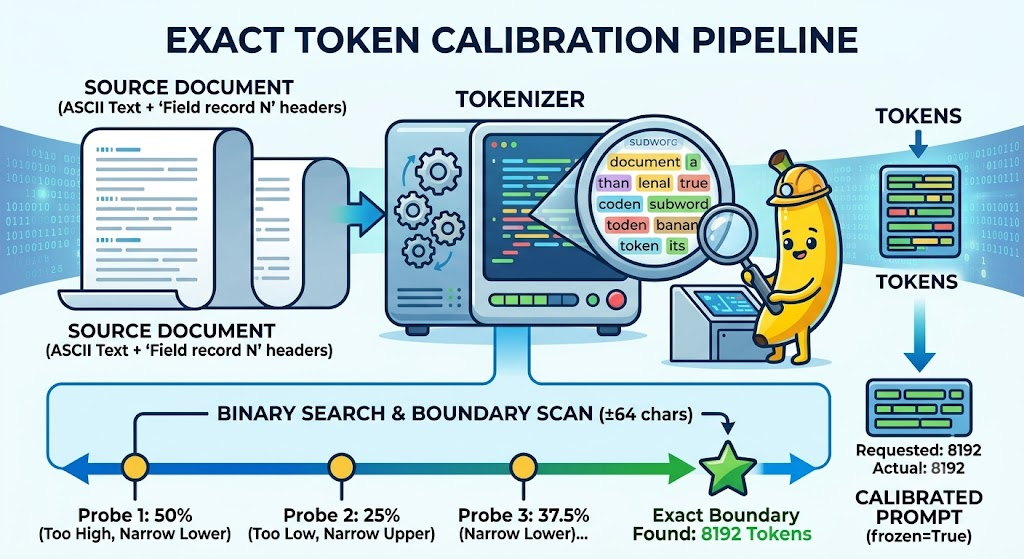
The calibration pipeline: hitting an exact token count
The core challenge of this benchmark is that subword tokenizers (Byte-Pair Encoding, SentencePiece, etc.) don’t split at byte boundaries. You can’t just truncate a string to N bytes and expect N tokens. The calibration pipeline solves this by working backwards: build a large enough document, then finding the longest prefix that tokenizes to exactly the target count.
Building a candidate document
def build_candidate_document(minimum_chars: int) -> str:
    """Build deterministic, document-like ASCII text of at least this size."""
    sections: list[str] = []
    size = 0
    index = 0
    while size < minimum_chars:
        passage = _PASSAGES[index % len(_PASSAGES)]
        section = f"\n\nField record {index + 1}\n{passage}"
        sections.append(section)
        size += len(section)
        index += 1
    return "".join(sections)
This is the first phase of a two-step process. Given a target like 8K tokens and an estimate of 5 chars-per-token, it produces roughly 40K bytes of concatenated passage text with "Field record N\n" headers. The headers serve a subtle purpose: they change every repetition, which means the binary search (§164) never sees a long flat region where adding more text contributes zero tokens. Without headers, you could easily spend dozens of binary-search iterations walking through a stretch of text that the tokenizer collapses into the same tokens.
Binary search: finding the token boundary
def calibrate_prompt(
    client: PromptTokenizer,
    source: str,
    target_tokens: int,
    *,
    boundary_scan_chars: int = 64,
) -> CalibratedPrompt:
Given a candidate document, this function locates the exact character index where the tokenizer output reaches target_tokens. The algorithm is a binary search with a fallback scan:
-
Binary search (§164–177) — probes the midpoint, then narrows to the upper or lower half. If it hits an exact match, it returns immediately.
-
Boundary scan (§179–189) — the binary search narrows to the region just before the target, but subword boundaries can be jagged. A ±64-character linear scan catches the exact boundary the binary search skipped.
-
Best-effort fallback — if no exact boundary exists (some tokenizers simply can’t produce N tokens from any prefix), the function returns the closest under-target prompt with
exact=False. This prevents the benchmark from silently reporting a wrong length.
A local cache (dict[int, int]) memoizes tokenize_prompt() calls so the same substring is never tokenized twice during the search, cutting the total tokenizer invocations from O(n) to O(log n).
Example walk-through — targeting 8192 tokens from a 100K-char document:
Binary search iterations:
  mid=50000 → 9200 tokens → too high, search lower half
  mid=25000 → 4100 tokens → too low, track as best, search upper half
  mid=37500 → 6800 tokens → too low, track as best, search upper half
  mid=43750 → 8400 tokens → too high, search lower half
  mid=40625 → 7500 tokens → too low, track as best, search upper half
  ...
  mid=42000 → 8192 tokens → exact match!
If the binary search lands at 8191 or 8193, the boundary scan checks characters 41936–42064 for the exact match. If none exists, it returns the prefix giving 8191 tokens with exact=False.
The entry point: guessing the right size
def prepare_exact_prompt(
    client: PromptTokenizer,
    target_tokens: int,
    *,
    initial_chars_per_token: int = 5,
    max_growth_attempts: int = 8,
) -> CalibratedPrompt:
This is what run_prefill_scaling calls. It guesses an initial document size (target_tokens * 5, minimum 4096), builds it, and checks whether it’s large enough. If the first guess undershoots (the tokenizer produces more tokens per character than expected), it doubles the document size and tries again — up to 8 times.
The initial_chars_per_token parameter defaults to 5 because English prose with typical tokenizers averages 4–6 characters per token. If you’re benchmarking a model with a very different tokenizer (e.g., one that uses emoji-based vocabulary and produces fewer tokens per English character), you’d lower this value to save growth attempts.
# Typical flow for target_tokens=8192:
#   Attempt 1: 8192 * 5 = 40960 chars → 12000 tokens → enough, calibrate
#   (returns CalibratedPrompt(text=..., requested_tokens=8192, actual_tokens=8192))
Why this matters
The calibration pipeline is what lets the benchmark claim “we measured 8K-token prompts” instead of “we measured 8K-token-ish prompts.” Without it:
- You’d be stuck measuring whatever token length your byte truncation happened to produce.
- Different models (different tokenizers) would get different actual lengths, making cross-model comparisons meaningless.
- The
exactflag onCalibratedPromptis a contract: if the benchmark saysexact=True, the length is genuinely exact. If it saysFalse, every consumer downstream knows the numbers are approximate and should be treated with caution.
The pipeline also makes benchmarking new models plug-and-play: you pass any object with a tokenize_prompt method, and the rest of the code works without knowing the model’s architecture, vocabulary size, or tokenizer type.
Before any benchmark runs, the code defines a small set of data types that carry information between the calibration, request execution, and result aggregation stages. They’re what keep the output reproducible and the error handling from turning into a maze of nested conditionals.
Protocols: minimal interfaces
class TokenCount(Protocol):
    count: int


class PromptTokenizer(Protocol):
    """The small portion of ModelClient needed during calibration."""
    def tokenize_prompt(self, prompt: str) -> TokenCount: ...
TokenCount is a one-field data contract: it says “something returned a token count.” PromptTokenizer is a protocol that describes the tiny slice of ModelClient the calibration functions actually need: just tokenize_prompt(). By using a protocol instead of importing ModelClient itself, the calibration module stays decoupled. Any object with a matching tokenize_prompt method works, whether it’s the real client or a test double. This also makes the calibration logic swappable without dragging in the full network stack.
CalibratedPrompt: the prompt after it’s been measured
@dataclass(frozen=True)
class CalibratedPrompt:
    text: str
    requested_tokens: int
    actual_tokens: int

    @property
    def exact(self) -> bool:
        return self.actual_tokens == self.requested_tokens
CalibratedPrompt is the output of the calibration step. It holds three things:
text— the actual string to send to the model.requested_tokens— the length the caller asked for (e.g. 8192).actual_tokens— what the model’s tokenizer actually produced after the binary search (§173).
These two token counts won’t always match — subword tokenizers don’t split at byte boundaries — so exact is a quick guard. A benchmark that reports exact=False as if it were True would be lying, and this property makes that impossible to miss.
The class is frozen=True, so once calibration is done the data can’t be accidentally mutated. This matters because the same CalibratedPrompt is reused across all repetition requests for a given length; a mutation in request 3 would silently corrupt request 4’s data.
PrefillRequestResult: one request, one dataclass
@dataclass(frozen=True)
class PrefillRequestResult:
    index: int
    success: bool
    prompt_tokens: int
    prompt_tokens_exact: bool
    client_ttft_s: float
    total_time_s: float
    effective_prefill_tps: float | None
    cache_isolation_method: str
    error: str = ""
    start_time: float | None = None
    end_time: float | None = None
    # vLLM server-side metrics
    cached_tokens: int = 0
    server_ttft_s: float | None = None
    queue_time_s: float | None = None
    prefill_time_s: float | None = None
    engine_prefill_tps: float | None = None
Each benchmark run fires multiple requests per length (default 5). PrefillRequestResult captures the outcome of one such request. It carries both client-side timing (what we measured with time.monotonic()) and server-side metrics that vLLM reports back (prefill_time_s, queue_time_s, engine_prefill_tps). Having both side’s numbers lets you spot discrepancies. For example, a long queue_time_s with a short prefill_time_s means the server was ready and fast, but the request sat in a backlog.
Notice that fields like start_time, end_time, and the server-side metrics default to None or 0. This way a single dataclass represents both success and failure: on error, success=False and error are populated while the timing fields stay at their defaults. The consumer doesn’t need a parallel error type.
_empty_stats: a safe fallback
def _empty_stats() -> dict[str, None]:
    return {"avg_s": None, "median_s": None, "p95_s": None, "min_s": None, "max_s": None}
When a length has zero successful requests (or zero TPS values), the aggregation step can’t compute statistics. _empty_stats() returns a dict full of None values with the same shape as a real _stat_summary() result. This keeps the JSON schema consistent: downstream tools don’t need to check for a missing key; they just see null and move on.
_per_request_summary: flattening a dataclass for JSON
def _per_request_summary(r: PrefillRequestResult) -> dict[str, Any]:
    return {
        "index": r.index,
        "client_ttft_s": round(r.client_ttft_s, 4),
        "total_time_s": round(r.total_time_s, 4),
        # ...
    }
PrefillRequestResult is a dataclass, but the benchmark output is a nested dictionary that will be serialized to JSON. _per_request_summary maps each field to a dict, applying round(..., 4) to float fields along the way. This is a thin serialization layer — it preserves every value while flattening the structure. Without it, you’d either be manually building dicts at every output site (duplicating logic) or dumping the raw dataclass (which includes Python-specific details and doesn’t round).
_error_result: one factory, three exception paths
The benchmark catches three kinds of exceptions during request execution, and each path needs to build a PrefillRequestResult with success=False. Instead of duplicating that dataclass construction three times (which is how bugs creep in, one path updates a field the other forgets), the code uses _error_result:
def _error_result(
    idx, exc, is_server_unreachable, is_oom,
    cache_method, req_start,
    *, is_status_change=False, status_to_set=None,
) -> tuple[PrefillRequestResult, str | None, bool]:
The factory returns three values:
| Return value | Meaning |
|---|---|
PrefillRequestResult |
A failed result object to append to the results list |
str \| None |
A new length_status to apply (e.g. "server_unavailable" or "oom") |
bool |
Whether to stop benchmarking at all (OOM = GPU is full, can’t continue) |
Why return three values instead of putting them all on the dataclass? Because length_status and should_stop are per-length concerns, not per-request concerns. A single OOM on request 3 out of 5 means all five requests share the same result object, but the length status changes to "oom" and the entire benchmark stops. Keeping these separate from the request result keeps each layer of abstraction focused.
Example flow — an OOM during the 3rd of 5 repetitions at 32K tokens:
client.generate()raisesHTTPError("429: MemoryError")._error_result()is called withis_oom=True,is_status_change=True,status_to_set="oom".- It returns a failed
PrefillRequestResult+"oom"+True. - The loop appends the result, sets
length_status = "oom", and setsstopped = True. - Requests 4 and 5 are still appended (they already fired), but the loop skips the 64K length entirely because
stoppedis nowTrue.
This pattern — factory returns a tuple of (result, status, stop) — keeps the try/except bodies clean and ensures every failure path produces the same dataclass structure.
The main benchmark function: run_prefill_scaling
All the pieces above assemble into the orchestrator.
Configuration and cache detection
def run_prefill_scaling(
    client: ModelClient,
    target_lengths: list[int] | None = None,
    repetitions: int = 5,
    gpu_monitor=None,
) -> dict[str, Any]:
The function starts by building a config dict that captures every assumption and setting. This is what makes a benchmark result reproducible: anyone running the same model with the same config should get the same results.
A key step: cache isolation detection (§302). The vLLM server supports a cache_salt header that forces each request to start with a cold cache. If the server supports it, the benchmark uses that header; if not, it falls back to prepending a unique text string.
is_header = client.preflight_cache_salt()
cache_isolation_method = "cache_salt" if is_header else "text_salt"
The default target_lengths — [512, 2048, 8192, 32768, 65536] — is a geometric progression (multiplying by 4 each step). This captures the expected relationship: if doubling the prompt doubles the prefill time, the throughput curve should be flat. A steep slope means the implementation doesn’t scale linearly.
The outer loop: per-length orchestration
stopped = False
for length in target_lengths:
    length_key = str(length)

    if stopped:
        results["per_length"][length_key] = {"status": "skipped_after_oom"}
        continue
The outer loop iterates over each target length. The stopped flag is the OOM guard: if the GPU runs out of memory, subsequent lengths are marked skipped_after_oom rather than crashing. This is significant because larger prompts consume more memory. An OOM at 32K almost certainly means 64K won’t fit either, and the benchmark would fail redundantly.
Each length follows a fixed sequence:
1. Calibrate  → find a prompt with exactly `length` tokens
2. Warmup     → fire one request (errors swallowed)
3. Sleep      → 0.5s stabilization gap
4. Measure    → fire `repetitions` requests, collect results
5. Stop GPU   → stop the telemetry window for this length
6. Aggregate  → compute stats and attach to output
Why the warmup? The server’s prefix cache, JIT compilation, and memory allocator need a “first run” to settle. Without it, the first measured request is always artificially slow, skewing averages. The warmup request’s errors are ignored because a misbehaving first request shouldn’t poison the benchmark data.
The inner loop: measuring requests
Each length gets repetitions requests (default 5). Each request has a unique cache_salt to guarantee cold cache. Without it, the server might reuse the prefix from a previous request, invalidating the benchmark.
for req_idx in range(repetitions):
    req_salt = uuid.uuid4().hex
    req_start = time.monotonic()
    ...
    gen = client.generate(calibrated.text, max_tokens=1, cache_salt=req_salt)
max_tokens=1 is deliberate: it minimizes decode-time contamination. The benchmark wants to measure prefill throughput, so output generation time is noise.
Error handling — the try/except chain catches three categories:
| Exception | Status | Stops benchmark? |
|---|---|---|
ConnectionError |
server_unavailable |
Yes (server is down) |
HTTPError with “oom”/”memory” |
oom |
Yes (GPU is full) |
| Any other exception | keeps current status | No |
This uses the _error_result() factory from the previous section, keeping each try/except body to 5 lines:
except requests.exceptions.HTTPError as exc:
    is_oom = "memory" in str(exc).lower() or "oom" in str(exc).lower()
    req_result, new_status, new_stopped = _error_result(
        req_idx, exc, is_server_unreachable=False, is_oom=is_oom,
        cache_method=cache_isolation_method, req_start=req_start,
        is_status_change=is_oom, status_to_set="oom",
    )
    if new_status:
        length_status = new_status
    stopped = stopped or new_stopped
The 0.5s gap between requests (§419) gives the GPU memory allocator time to settle between requests. Without it, allocations and deallocations overlap, making measurements noisy.
Aggregation and output
After all repetitions finish, the results are aggregated into a nested structure:
successes = [r for r in length_results if r.success]
ttfts = [r.client_ttft_s for r in successes]
tps = [r.effective_prefill_tps for r in successes if r.effective_prefill_tps is not None]
engine_tps = [r.engine_prefill_tps for r in successes if r.engine_prefill_tps is not None]

results["per_length"][length_key] = {
    "status": length_status,
    "requested_tokens": length,
    "actual_tokens": calibrated.actual_tokens,
    "prompt_length_tolerance": length - calibrated.actual_tokens,  # typically 0 or -1
    "n_requests": len(length_results),
    "n_success": len(successes),
    "per_request": [_per_request_summary(r) for r in length_results],
    "aggregated": {
        "ttft": _stat_summary(ttfts),
        "effective_prefill_tps": _stat_summary(tps) if tps else _empty_stats(),
        "engine_prefill_tps": _stat_summary(engine_tps) if engine_tps else _empty_stats(),
        "gpu": gpu_summary if gpu_summary else {},
    },
}
Key fields worth understanding:
-
prompt_length_tolerance— the difference betweenrequested_tokensandactual_tokens. In most cases this is 0; if the tokenizer can’t produce an exact boundary, it’s -1 or -2, and theexact=Falseflag inCalibratedPrompttells downstream consumers not to treat the length as precise. -
ttft— “time to first token”, measured client-side withtime.monotonic(). The stats includeavg_s,median_s,p95_s,min_s,max_sfrom_stat_summary(). -
effective_prefill_tps— client-side calculation:prompt_tokens / client_ttft_s. This is what we measured. -
engine_prefill_tps— server-side calculation from vLLM:prompt_tokens / prefill_time_s. This is what the server measured.
Comparing these two gives insight into where time is spent: a high gap between client and engine throughput means the server’s timing excludes something we account for (network latency, queue time, etc.).
GPU energy tracking
If a GpuMonitor is attached, the function computes energy-per-token (§428):
energy_per_input_token_wh = energy_wh / actual_tokens
This is significant for benchmarking. Tt lets you measure not just how fast a model is, but how energy-efficient it is at each prompt length. Energy cost is often the real constraint in production deployments.
Why this structure matters
run_prefill_scaling is a template for any benchmark: detect assumptions → validate inputs → measure in controlled iterations → handle failures gracefully → aggregate with statistics. The function is intentionally data-driven: change the target_lengths list or the repetitions count and the same code handles it. This separation of orchestration from measurement is what makes the benchmark extensible.
You can find the full source code on GitHub
Stay tuned for the next part!
CZ