Developing my own Benchmark Pt. 4 (TTFT)
In this post, I want to discuss the TTFT benchmark in more detail, since it is crucial for the benchmarking of the request life cycle.
TTFT
We define the TTFTRequestResult as a data class that looks like this:
@dataclass(frozen=True)
class TtftRequestResult:
    """Single request within the TTFT breakdown benchmark."""

    index: int
    success: bool
    # Token counts
    prompt_tokens: int
    output_tokens: int
    # Client-side wall-clock (ms), None when request failed
    ttft_ms: float | None
    total_time_ms: float | None
    # Server-side metrics (s), may be None on older vLLM versions
    queue_time_s: float | None = None
    prefill_time_s: float | None = None
    server_ttft_s: float | None = None
    # Derived breakdown components (ms)
    scheduler_delay_ms: float | None = None
    prefill_ms: float | None = None
    first_decode_ms: float | None = None
    # Error
    error: str = ""

    @classmethod
    def error(cls, *, index: int, exc: BaseException) -> TtftRequestResult:
        """Return a failed request result."""
        return cls(
            index=index,
            success=False,
            prompt_tokens=0,
            output_tokens=0,
            ttft_ms=0.0,
            total_time_ms=0.0,
            error=str(exc),
        )
We want to track the following metrics:
- Client-side TTFT: wall-clock time from request to first token on the client
- Server-side queue time: how long the request sat in vLLM’s scheduler queue
- Server-side prefill time: time to process the full prompt through the model
- Server-side TTFT: the server’s own measurement of time to first token
- Derived breakdown: scheduler delay, prefill, and first-decode-overhead components in ms
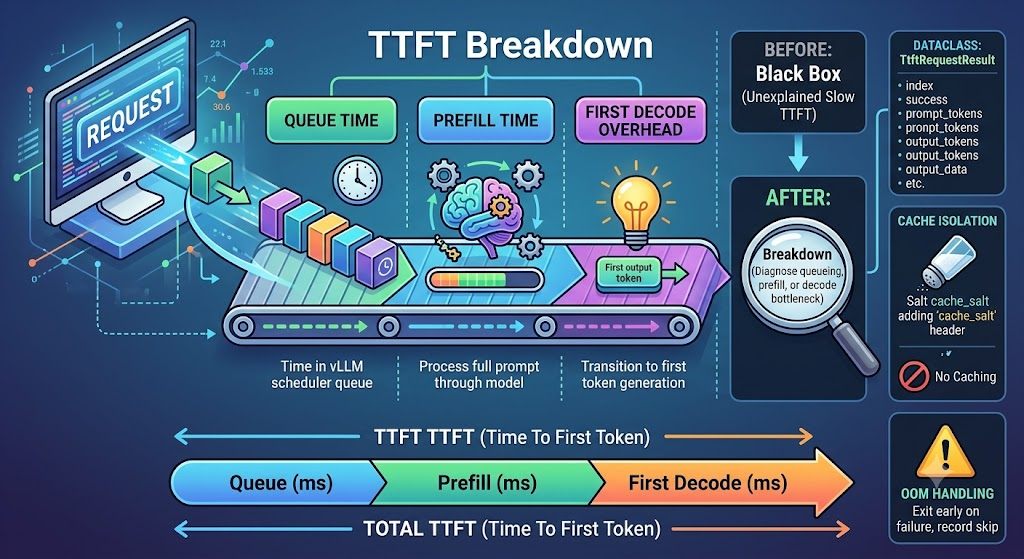
The key insight is that client-side TTFT is a black box: it includes network latency, client processing, queueing, prefill, and the first decode step. By pulling the server-side metrics that vLLM already emits (but previously hid inside ModelClient._execute_request()), we can decompose TTFT into three additive components:
TTFT = queue_time + prefill_time + first_decode_overhead
Where first_decode_overhead is the time from the last prefill token to the first output token. This captures the first decode kernel launch, scheduler overhead, and any internal batching friction.
Data Structure Design
The TtftRequestResult dataclass is frozen=True (immutable) because each request measurement is a point-in-time snapshot. Once captured, it shouldn’t change. Freezing also makes the results hashable and safe to pass between functions without worrying about mutation.
Every request tracks both client-side and server-side metrics, plus derived components. The server-side fields are float | None because older vLLM versions may not emit request_metrics. The benchmark degrades gracefully rather than crashing when these fields are absent. A dedicated error() classmethod constructs failed results in one line, keeping the error path clean and consistent.
Cache Isolation Strategy
The benchmark sends cold requests (no cache hits) to measure worst-case TTFT. To prevent vLLM from reusing prefix-cache entries, each request gets a unique cache_salt header (via uuid.uuid4().hex). Before the benchmark runs, preflight_cache_salt() checks whether the running vLLM instance actually supports cache salts. If not, it falls back to text_salt (appending random text to the prompt). This detection step ensures the benchmark works across vLLM versions without manual configuration.
A single salt per request is sufficient because the benchmark sends requests sequentially (with a 0.5 s stabilization gap between repetitions), so there is no concurrency to worry about at this level.
The Breakdown Computation
For each request, the benchmark extracts three server-side timings and derives three components:
first_dec_s = (
    max(0.0, server_ttft - queue_s - prefill_s)
    if queue_s is not None and prefill_s is not None and server_ttft is not None
    else server_ttft
)
The max(0.0, ...) guard handles clock-skew edge cases where floating-point rounding or scheduler timing quirks produce a negative value. TTFT is never actually less than the sum of its parts.
When the server doesn’t support queue_time or prefill_time (older vLLM), first_decode falls back to the full server TTFT. The benchmark doesn’t pretend to know more than it does. None propagation is the honest choice. The intermediate variables (sched_delay_s, pref_s, first_dec_s) were dropped from the original draft in favor of inline _ms() calls, since they’re only used once and the extra bindings clutter the flow without adding readability.
Prompt Construction Tradeoff
For each target prompt length, the benchmark builds a simple repeated "hello world " string (roughly 2 tokens per word pair, padded to the target). This is a deliberate simplification: the earlier core_runner.py post describes how prefill.py uses a proper tokenizer for exact-length prompts, but for this TTFT breakdown benchmark, word-level approximation is sufficient because:
- The focus is on timing decomposition, not on exact token counts
- The actual token count is reported via
gen.prompt_tokens, so the JSON output always has the ground truth - Tokenizer-based prompt building would add complexity (a dependency on the model’s tokenizer) that isn’t needed for a timing-only benchmark
Future phases can layer in exact-token prompts; the current version measures what matters for TTFT decomposition without over-engineering.
OOM Handling and Early Exit
If a request fails with an OOM or memory error, the benchmark records the failure and sets a stopped flag. All subsequent prompt lengths are skipped with a "skipped_after_oom" status. This prevents cascading failures and produces a clean JSON file that clearly shows which prompt lengths fit in GPU memory and which don’t.
A more sophisticated approach would try to reduce the batch size or switch to a different quantization, but for a benchmark that’s measuring fixed configurations, an explicit failure is the right signal.
Output Structure
The benchmark returns a nested dict with config metadata and per_length results. Each length bucket contains:
- Per-request details (every individual measurement, serialized to JSON via
asdict()) - Aggregated statistics via
_stat_summary()(mean, median, p95, p99, min, max for TTFT, scheduler delay, prefill, and first decode) - GPU telemetry summary (if a monitor was provided)
The per-request granularity is important. Aggregate numbers hide outliers. Seeing every individual request’s TTFT and breakdown lets you spot scheduling hiccups, GPU memory fragmentation, or one-off kernel compilation latency that would average out to nothing. Using dataclasses.asdict() keeps the serialization DRY instead of manually listing every field.
Why This Matters
TTFT is the single most important metric for user-facing latency. A model that decodes at 200 tok/s feels great if the first token arrives in 50 ms. A model that decodes at 300 tok/s feels terrible if the first token takes 2 seconds. Without decomposing TTFT, you can’t tell whether a slow first token comes from queueing (a concurrency/scheduling problem), prefill (a compute/architecture problem), or first decode (a kernel or GPU memory problem).
The full code lives in https://github.com/czhou578/model-benchmarks/blob/main/benchmarks/ttft_breakdown.py
Stay tuned for more!
CZ