Pruning DeepSeek v4 Flash 0731: Removing cold experts
In my last post, I pruned DeepSeek V4 Flash 0731 from 216 to 160 routed experts per layer, with a rank that came from my stock-research bot’s own traffic. The pruned model loaded 74.09 GiB of weights, 21.30 GiB less than the stock model.
But my router plan had a cap of about 72 GiB for DeepSeek, to leave room for a second model. The pruned model was still 2.09 GiB over that cap.
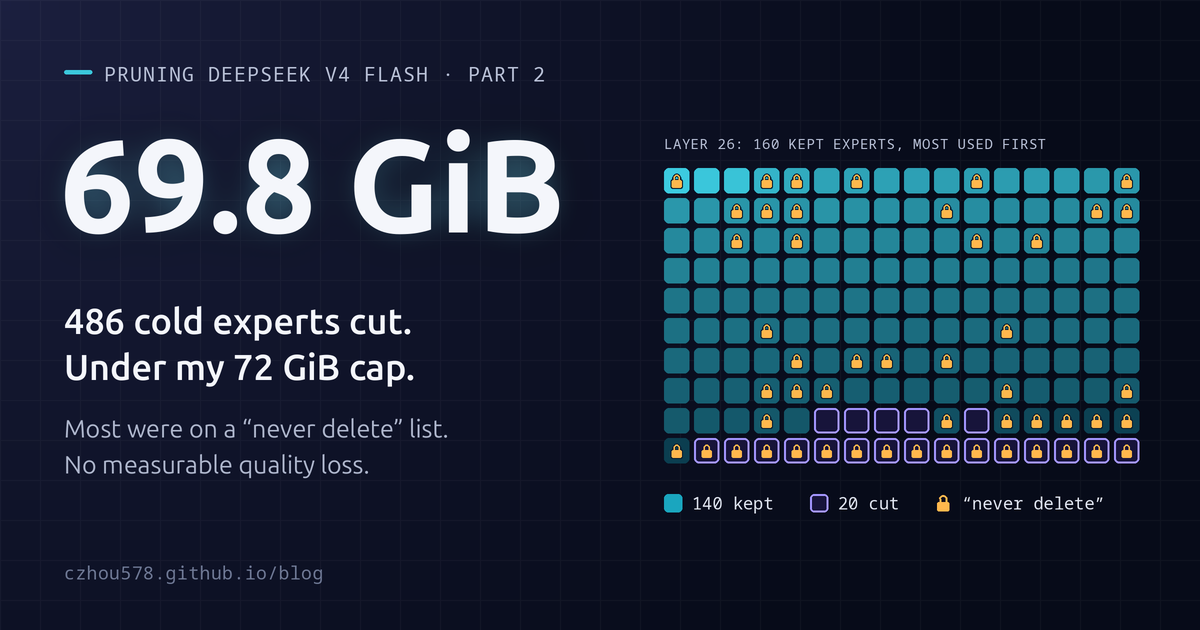
This post is about how I reduced the model size even further. I found 486 experts that my bot almost never used, and that every earlier cut had protected by a rule. I removed them and patched the server so that each layer could keep a different number of experts. The live model now loads 69.79 GiB, and my tests found no measurable loss.
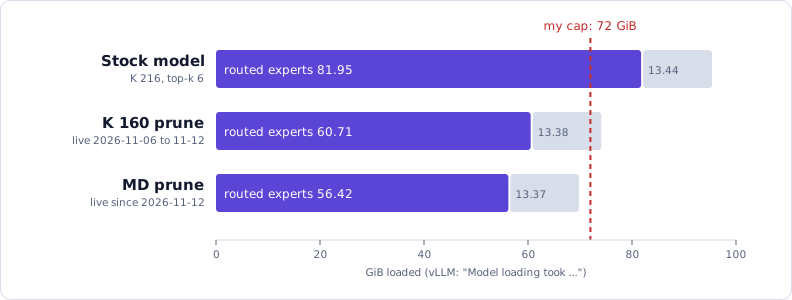
The loaded weights, drawn to scale. The routed experts are violet, and the rest of the model (attention, dense layers, embeddings, head) is grey. The MD prune is the model of this post: it is the first one under my 72 GiB cap.
Here is the live model at the start of this work, on 2026-11-06:
| Item | Value |
|---|---|
| Live model | tp1-k160t5: the bot-rank prune at K 160 and top-k 5 |
| Routed experts per layer (K) | 160 in all 43 layers: 6,880 experts |
| Experts per token (top-k) | 5 routed + 1 shared |
| Routing, layers 0 to 2 | Hash: a fixed token-to-expert table (ffn.gate.tid2eid) |
| Routing, layers 3 to 42 | Learned router with a gate bias |
| One expert | 9.04 MiB, in 12 EXL3 tensors |
| Weights loaded | 74.09 GiB, of which 60.71 GiB were routed experts |
| Draft model | dspark-draft-k64-bot: 64 MTP experts, chosen by the bot rank |
The terms are the same as in the last post. K is the number of routed experts that a layer keeps. Top-k is the number of experts that each token uses. A mask hides experts from the router but still loads them, so it tests quality but frees no memory. A prune removes the experts from the weight files.
Three ideas that did not get me there
After the deploy of the K 160 prune, I tried three more ideas to make the model smaller or faster.
- A better rank for K 144. I patched the capture to record the router weight of each pick, not only the count, and built four new ranks. At K 160, the best new rank scored the same as the live pick, within the run noise. At K 144 (about 68 GiB), every rank failed the +3% NLL gate, at +3.29% to +3.90%.
- Fewer experts per token. A router patch dropped the weakest expert slots of each token by several rules. Every cut below 5 experts per token failed the gate, at +6.4% to +21.8%.
-
The serving settings. I tested 11 ideas, and one went live: I lowered the KV cache pin from 8 GiB to 7.25 GiB. The 265,498 tokens still held 1.04 times the 256k context, and the change freed 0.75 GiB.
I did not deploy a draft model with 128 MTP experts: it gave +4.2% decode speed, right at the noise floor, for 2.39 GiB of memory.
After these three ideas, K 160 looked like the floor for this model without a fine-tune. Each step below it cost about 0.5 points of NLL for each point of routing share that it removed. A better rank changed that cost by 0.2 points at most.
But I then thought of a different question: of the 74 GiB of weights, how much did my bot not need at all?
Measure what each kept expert does
The rank of the last post counted how often the router picked each expert. A count treats a pick with a router weight of 0.01 the same as a pick with a weight of 0.5. For this question, I needed a better measure.
The data already existed: for idea 2, I had run the patched capture of idea 1 on the K 160 mask. It covered 63 segments of 55 calibration sessions, with 2.84 M prompt tokens. As before, no held-out session entered the capture.
For each expert, the script summed its router weights over all tokens. The weight share of an expert was that sum divided by the sum of all experts in its layer.
I called a kept expert cold if its weight share was small. Here is the cold tail of layers 3 to 42. Layers 0 to 2 use the hash table, and none of their experts was below 0.1%.
| Set | Experts | Mandatory | GiB | Weight share lost per layer, mean (max) |
|---|---|---|---|---|
| Weight share below 0.05% | 118 | 118 | 1.04 | 0.06% (0.18%) |
| Weight share below 0.1% | 268 | 257 | 2.36 | 0.36% (0.73%) |
| Weight share below 0.2% | 894 | 512 | 7.89 | 2.88% (5.38%) |
The “Mandatory” column surprised me. Of the 268 experts below 0.1%, 257 were mandatory tool experts.
The mandatory rule
My mask tool, mask_checkpoint.py, had one rule that I took from the REAP plan: never drop a mandatory expert. The REAP plan ranked the experts of each layer in two tool categories, agentic_tool_trajectory and tool_calling. The top 32 experts of each category were mandatory.
The rule made sense for a first cut. My bot lives on tool calls, and I did not want to break them. But REAP chose those experts on a public data set: 4,096 tool-calling rows and 2,253 agent trajectories.
About 46 of the 160 kept experts in each layer were mandatory. Together they held 26% of the routing weight, so some of them were very warm.
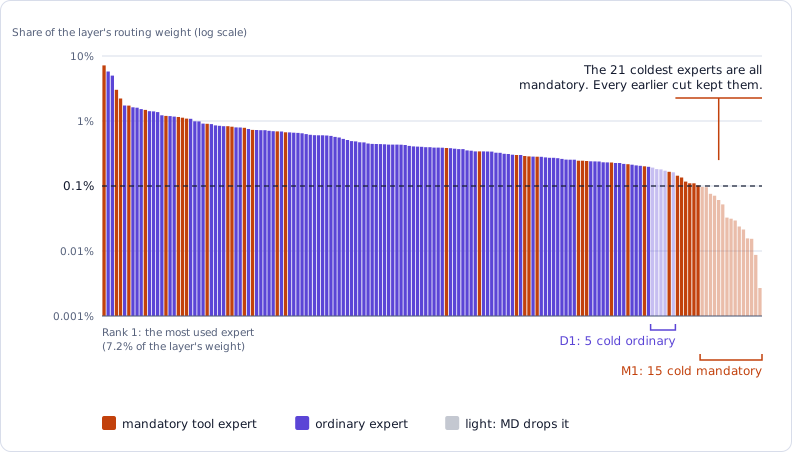
Layer 26, expert by expert. Each bar is one of the 160 kept experts, most used on the left. The scale is logarithmic, so each grid line is ten times the one below it. The 21 coldest experts were all mandatory tool experts, and 15 of them were below 0.1%. The light bars are the experts that the MD cut (below) dropped.
This also explained the K 144 failure. Every earlier cut kept the mandatory experts, so a cut to K 144 had to drop 16 more ordinary experts per layer, and those were warmer. To free 2 GiB, a cut of cold tool experts lost 0.33% of the routing weight per layer. A cut of ordinary experts lost 0.92% for the same memory.
My hypothesis was that my bot needed a different set of tool experts than the REAP data, and that the cold mandatory experts could go.
Four masks
I tested the hypothesis with four masks. Each mask dropped the 56 live drops of each layer, plus one set:
| Point | Drops in addition to the live drops | Experts | GiB after a prune | K in layers 3–42 | Question |
|---|---|---|---|---|---|
| R0 | None: the live set as a mask | 0 | 0 | 160 | The reference |
| M1 | The mandatory experts below 0.1% weight share | 257 | 2.27 | 145–159 | Does the bot need the cold tool experts? |
| D1 | The coldest ordinary experts, up to 1% of the layer’s weight | 229 | 2.02 | 151–156 | Does the bot need the cold ordinary experts? |
| MD | M1 and D1 | 486 | 4.29 | 140–154 | Do the two costs add up? |
M1 and D1 freed about the same memory, so the pair showed which kind of cold expert cost less.
A few rules held for all four points:
- Layers 0 to 2 did not change. They kept the live 160 experts and the live hash tables. A smaller K in a hash layer needs a new remap of the
tid2eidtable, and I had no test for that. - The exact ids came from a file. The mask tool got a new option,
--drop-file, which reads the ids to drop in each layer from a JSON file, mandatory or not. A new script,cold_sets.py, wrote the four files from the rank, the REAP plan and the live mask. - R0 was a mask, not the live prune. A mask and a prune of the same set had differed by 0.37% NLL, so each point had to compare against a mask.
- Every point used top-k 5. Each folder went through
topk_checkpoint.py, as in the last post.
Tighter gates
The gate of the last post (+3% against the stock model) was too coarse for this question, because each cut would cost only a fraction of a percent. Instead, I compared each point against the R0 of the same window. A point had no measurable cost if all of these were true:
- The summed NLL rose by at most 0.5% against R0.
- The tool names fell by at most 1 call.
- The decisions fell by at most 1. A decision is correct when the model’s first choice for the first answer token matches the recorded turn. That token decides if the turn starts with a tool call or with text.
- The smoke test passed: one request with a JSON schema, one tool call with
tool_choice: auto, and one withrequired.
Each point also had to pass the old gate against the stock model. And R0 had to match the earlier K 160 mask within 0.5%. If it did not, the folders or the server image had changed, and the window gave no answer.
The first window
The first window started at 23:33 on 2026-11-10 and stopped my live server for 2 h 38 min. For each point, a script booted the mask, ran the smoke test and the replay screen, and stopped the server. I paused the cron jobs of my bot for the night.
A mask loads all 216 experts (95.4 GiB), so only about 3 GiB stayed free after each boot. The memory watch never came near its 1 GiB stop.
| Point | NLL against stock | NLL against R0 | Decisions (stock: 41 of 60) | Tool names (stock: 77 of 83) | Smoke |
|---|---|---|---|---|---|
| R0 | +2.38% | – | 41 | 77 | Pass |
| M1 | +2.80% | +0.42% | 43 | 78 | Pass |
| D1 | +3.10% | +0.70% | 37 | 79 | Pass |
| MD | +2.84% | +0.46% | 42 | 79 | Pass |
R0 was +0.09% against the earlier K 160 mask, so the window was valid.
M1 was the clear result. It cost +0.42% against R0, and its decisions rose by 2. Without the 257 cold tool experts, the model still passed the smoke test, with valid tool calls and valid JSON. My bot did not need them, and the mandatory rule had protected 2.27 GiB for nothing.
D1 and MD contradicted each other. D1 cost +0.70% and failed both the R0 gate and the stock gate. MD cost only +0.46% and passed. But MD dropped every expert that D1 dropped, plus the 257 experts of M1. A larger cut cannot cost less, so the gap between the two had to be noise.
The NLL gap was 0.24 points, inside my noise floor of 0.23% to 0.37%. But MD also had 5 more correct decisions than D1, and my noise floor for decisions was only 1. D1 sat just above the 0.5% limit and MD just below it, so one window could not decide. I repeated R0, D1 and MD in a second window.
The repeat window
The second window ran on the morning of 2026-11-11, from 08:30 to 10:29. R0 passed its check again, at +0.22% against the earlier K 160 mask. It was also +0.12% against the R0 of the first window.
| Point | Against R0, window 1 | Against R0, window 2 | Mean |
|---|---|---|---|
| M1 | +0.42% | – | – |
| D1 | +0.70% | +0.03% | +0.36% |
| MD | +0.46% | −0.10% | +0.18% |
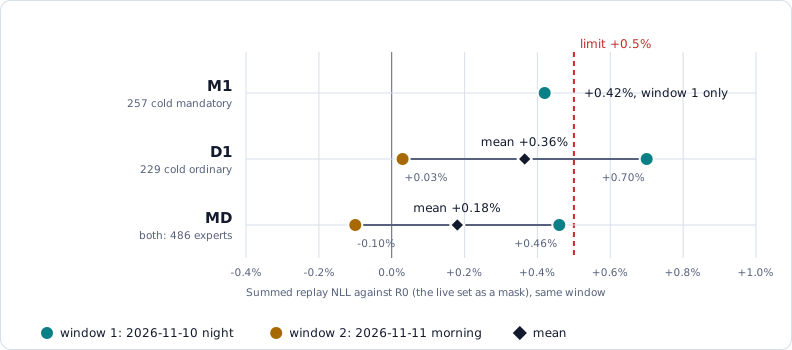
Each dot is one mask in one window, against the R0 of the same window. M1 needed no repeat, because MD drops all of its experts and passed twice.
The repeat showed that my noise floor was too small for these masks. The NLL of one folder moved by up to 0.56% between the two windows. No target gave the same NLL twice, and one target moved by up to 25% of its NLL. The totals hid this, because the changes went in both directions.
MD also passed the stock gate and the smoke test in both windows, so my bot did not need the 486 cold experts. A prune of MD would free 4.29 GiB: enough to get under the cap.
A different number of experts in each layer
To free the memory, I had to prune MD out of the files. But MD kept a different number of experts in each layer.
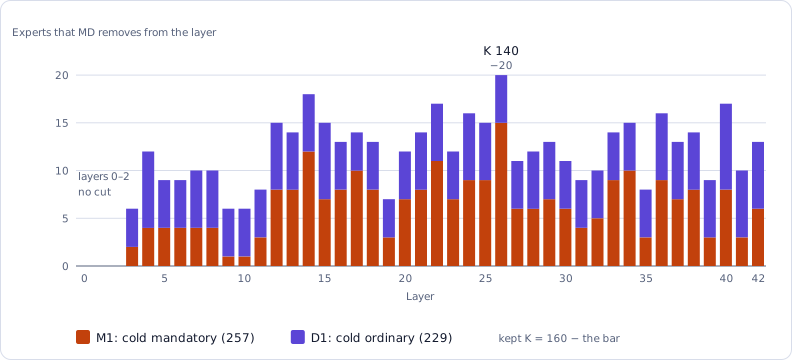
The experts that MD removed from each layer, on top of the 56 of the live prune. Layer 26 lost the most, 20, and kept 140. Layers 0 to 2 lost none. The result had 15 distinct counts: 140, 142 to 154, and 160. The mean was 149, so the folder got the name tp1-prunemd5-k149.
The server read one expert count, n_routed_experts, for all layers. I read the runtime code of the pinned server image and found five places that tied the expert count to that one value:
| Place | What it did with the count |
|---|---|
DeepseekV4MoE.__init__ (model.py) |
Sized the gate rows, the router bias and the id range of tid2eid |
_init_fused_moe_experts (model.py) |
Passed the count to FusedMoE(num_experts=…) |
_configure_rank_sliced (exl3.py) |
Stored experts_per_layer as one integer |
create_weights (exl3.py) |
Stopped if experts_per_layer did not match the num_experts of the layer |
_rank_sliced_runtime (exl3.py) |
Kept one runtime for each expert count |
The routing kernel needed no change. Its fast path supports only counts such as 128, 192 and 256, so even the live K 160 already ran on the general path, which accepts any count.
The first four places needed only a lookup of the layer’s own count. The fifth place was the trap.
The trap: one arena per count
The EXL3 loader builds one SparkInfer runtime for each distinct expert count, because a SparkInfer plan fits one MoE shape. Each runtime then allocated its own scratch. The prefill scratch, the arena, was 1,277 MiB at the live settings. The live model had one count, so it had one arena, and all its MoE layers shared it.
MD had 15 counts. An unpatched loader would allocate 15 arenas: about 18.7 GiB, four times the memory that the prune freed. A comment in exl3.py even warned that per-layer runtimes “would cost tens of GiB” and “are not affordable”.
But the cost was the scratch, not the plan. The patch kept one plan for each count, as SparkInfer requires, but gave all the plans one shared scratch pool:
- At the first runtime of a model, the patch read the per-layer list from the config and planned all the counts of that model.
- It allocated each pool buffer once, at the largest size of all the plans.
- Each runtime got a view of the pool, with the shape of its own plan.
- The pool never grew, so the pointers that the CUDA graphs captured stayed valid.
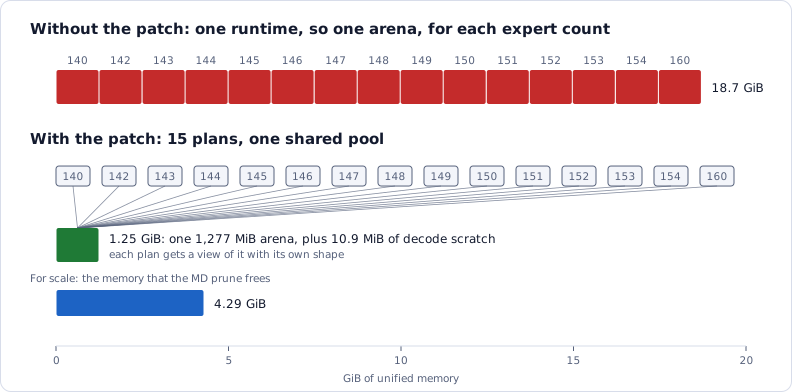
The scratch of the 15 expert counts without and with the patch, drawn to scale.
The sharing was safe for the same reason that the live model could share one arena: the MoE layers run one after another, so no two layers use the scratch at the same time. The side streams of the model belong to the attention, not to the routed experts.
Two more details mattered:
- The draft model. The DSpark draft builds its layers with the target’s config, and gives them the layer indices 43 and up. The patch therefore used the per-layer list only for layers 0 to 42. Every other layer used the plain
n_routed_experts, so the draft kept its 64 experts and its own scratch. - The folder format.
config.jsonkeptn_routed_expertsat the largest count, 160, and a new key,n_routed_experts_per_layer, held the 43 values. A folder without the new key loaded exactly as before, so the patched image could still serve the live folder.
The patch was a diff of model.py and exl3.py from the pinned image. A build script copied these files out of the image and applied the diff. A test compose file then mounted the patched files over the originals, so the server repo did not change.
The kernel check
Before I stopped my live server again, I checked the patch on the GPU, with the bot up. A script ran the real experts of layer 26 through the patched pool and SparkInfer, in two ways:
- the K 160 prune, with 160 experts;
- the MD prune, with 140 of the same experts, and top-k ids that pointed only at those 140.
| Check | Decode (4 tokens) | Prefill (512 tokens) |
|---|---|---|
| The MD output equals the K 160 output, bit for bit | Yes (max difference 0.0) | Yes (0.0) |
| The MD output does not change after a K 160 run on the same pool | Yes | Yes |
| K 160 on the pool equals K 160 with its own scratch | Yes | Yes |
The check also showed that the arena did not depend on the count: it was 1,277.1 MiB for 140 experts and for 160. The first run of a new count took at most 2.05 s, to compile a few small routing kernels into the kernel cache.
One surprise came before these results. The first run of the check stopped before it loaded anything, because cudaMemGetInfo reported only 2.2 GiB free. On the GB10, that call does not count the page cache as free memory. The check now reads MemAvailable from /proc/meminfo, as my other test scripts do.
The prune of MD
The prune tool of the last post got one change: it accepts a different K in each layer, and it writes the per-layer lists into the config files. For a folder with one K, the new tool writes the same bytes as the old one.
The build ran on 2026-11-11 in 10 minutes, with the bot up. It removed 34,728 tensors: the 2,894 dropped experts (the 2,408 live drops and the 486 of MD), 12 tensors each. The new folder held 6,394 experts and 73.24 GiB of tensors, against 77.53 GiB in the live folder: 4.29 GiB less. The self-check passed on all 48 files.
The test window
The test window booted the patched image twice, on 2026-11-11 from 11:10 to 13:44:
- P0: the patched image on the K 160 prune, with the same files as the live folder. This checked that the patch did not change a folder with one K.
- P1: the patched image on the MD prune.
| Gate | P0: the K 160 prune | P1: the MD prune | Result |
|---|---|---|---|
| Boot | 210 s, 74.09 GiB, one runtime | 211 s, 69.79 GiB, 15 counts on one pool | Pass |
| Memory available after the boot | 23,944 MB | 28,228 MB: 4.18 GiB more | Pass (gate: 4 GiB) |
| Smoke test | Pass | Pass | Pass |
| Replay, mean of two runs | – | +0.13% against the MD mask | Pass (gate: 0.6%) |
| Replay against stock, each run | – | +2.84% and +2.66% | Pass (gate: 3%) |
| Bot test, 5 runs | 34.81 tok/s | 34.35 tok/s (−1.3%) | Pass (gate: 4.2%) |
| Code test (no gate) | 39.94 tok/s | 37.98 tok/s (−4.9%) | Noted |
| Prefill at 8k tokens (no gate) | 1,370 tok/s | 1,356 tok/s (−1.0%) | Noted |
The 15 counts cost no boot time and no memory. The pool held one arena, plus 10.9 MiB of decode scratch. The memory gain, 4.18 GiB, was a little less than the 4.29 GiB of tensors.
The code test was 4.9% slower, and this was above its noise. The draft acceptance on code fell from 2.57 to 2.38 tokens per draft. The removed experts were cold on my bot’s traffic, not on code, so the pruned model agreed less often with the draft on code prompts. My bot writes almost no code, so no gate covered this test. But in the final review, I checked the quant skill first for a loss.
The final review
The replay screen has only 60 targets, so a deploy needed a larger test. The MD prune went through the same final review as the pick of the last post: the full runs, the LLM judge and a blind review. The base was now the live K 160 model, so the review measured only the cost of the cut.
- Four runs, one bot commit. Two base runs (
live-1,live-2) ran on the live server with no downtime. Then the MD prune ran twice (md-1,md-2) in a night window of 7 h 13 min. I froze the bot code at one commit, and all the runs fit in about 16 hours. That short span kept newer market data, the source of most wins in the last review, from favoring one side. - 76 test pairs and 38 control pairs. 2 MD runs × 2 live runs × 19 prompts gave 76 test pairs. The controls were
live-1againstlive-2andmd-1againstmd-2, with 19 pairs each. - The same judge for every pair. The judge was the live K 160 model, so any self-preference worked against the MD prune. It took 10 hours for the 114 pairs, with 0 errors.
- A Claude session for the blind review. This time, a Claude session filled in the blind review page, and I read its notes and the answers before I counted it as my review. That reviewer was not the live model, so the judge’s self-preference did not apply to it.
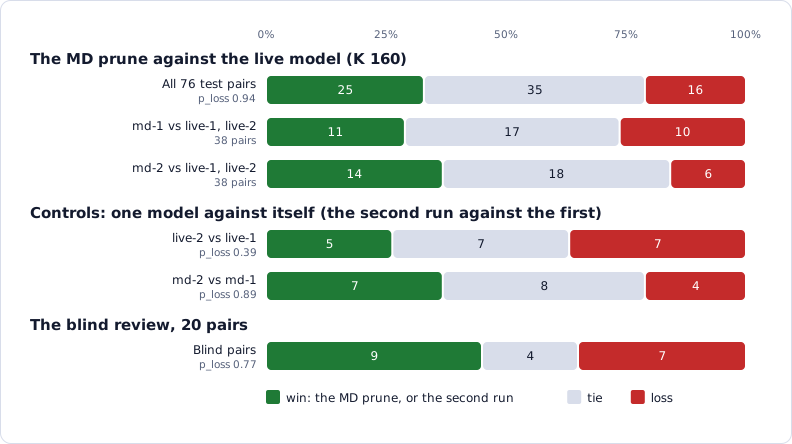
The judge found no loss, and the controls found no bias. The numbers are pair counts. “p_loss” is the chance of at least this many losses if the two models were equal; a result fails below 0.05. In a control, a win is a win of the second run.
The MD prune passed all three rules:
- LLM judge, 76 pairs: 25 wins, 35 ties and 16 losses for the MD prune. The fail line was 27 losses.
- Controls, 38 pairs: neither control reached its fail line in either direction.
- Blind review, 20 pairs: 9 wins, 4 ties and 7 losses for the MD prune. It would have failed at 12 losses of 16 decided pairs.
The judge and the blind review showed the same pattern by skill. The short tool tasks won: quant, filings, earnings and stock-update. The losses were in long research reports and subagent prompts, and those counts were too small for the sign test. The quant skill, my worry from the code test, had 2 wins, 2 ties and 0 losses from the judge, and a win in the blind review.
Hard faults
| Fault | MD runs | Live runs | Note |
|---|---|---|---|
| A wrong number | 10 pairs | 5 pairs | Not significant (p = 0.06). The same kind on both sides: a wrong percentage, multiple or range in a long report |
| Stray tokens in a long report | 12 pairs | 12 pairs | The same rate |
A literal </s>, an unknown tool, a missing save |
0 | 0 | In the last post, I blamed the first two on the mask. Neither came back |
The wrong numbers were the one quality result that leaned against the MD prune. I accepted them on 2026-11-12.
The run time. The MD runs took 16% longer in total than the live runs. They made about 4% more model calls, and each call took about 11% longer: 80.9 and 78.3 s against 71.3 and 71.4 s. That was more than the decode test showed (−1.3%). The MD runs ran at night on the test setup, so I checked this again after the deploy.
The deploy
I deployed the MD prune on 2026-11-12. The deploy script waited until the bot was idle, stopped the K 160 server, started the new one, and checked the boot log, the KV cache and a chat reply. Every check passed on the first try, and the downtime was about 3 minutes. The server kept both served names, so my bot and its cron jobs needed no change.
The bot test on the live server gave 35.27 tok/s before the deploy and 35.30 tok/s after it. A full run of the 19 prompts on the live server then checked the +11% per model call of the review. Each call took 78.4 s, 9.9% more than the live runs, so the test setup was not the cause. The decode rate did not change: each output token took 39.8 ms, against 38.8 and 40.6 ms in the live runs. Instead, the MD prune wrote longer answers, with about 8% more output tokens per call. The run had no hard fault.
This was above my +5% limit for the run, so I had to decide. I kept the MD prune, at a cost of about 1 to 2 more minutes per research session.
The final memory savings
Here is the stock model next to the two prunes:
| Stock model | K 160 prune | MD prune, live | |
|---|---|---|---|
| Routed experts per layer (K) | 216 | 160 | 140 to 160 (mean 149) |
| Routed experts in all layers | 9,288 | 6,880 | 6,394 |
| Experts per token (top-k) | 6 | 5 | 5 |
| Weights loaded | 95.39 GiB | 74.09 GiB | 69.79 GiB |
| KV cache | 7.36 GiB | 7.25 GiB, pinned | 7.25 GiB, pinned |
| Replay NLL against stock | 0 | +1.89% | +2.66% and +2.84% |
| Memory available, server idle | about 4 GiB | about 23 GiB | about 27 GiB |
In all, I removed 2,894 of the 9,288 routed experts, and the weights shrank by 25.60 GiB. The live model is now 2.21 GiB under my 72 GiB cap.
That memory is for the second model of my router. With a 10 GiB margin, its room grew from about 13 GiB to about 17 GiB. With a 4 GiB margin, it grew from about 19 GiB to about 23 GiB.
What came next
Two more tests ran after the deploy. Both said no.
A larger cold cut. M1 and MD passed, and D1 passed on the mean of its two windows, so the cut looked like it could grow. On the night of 2026-11-12, I tested two larger sets:
| Set | Drops in addition to the live drops | Experts | GiB after a prune | NLL against stock | NLL against R0 |
|---|---|---|---|---|---|
| S15 | MD, plus every expert below 0.15% weight share | 630 | 5.56 | +3.02% | +0.82% |
| S20 | MD, plus every expert below 0.2% weight share | 908 | 8.01 | +3.69% | +1.49% |
Both sets failed the stock gate and the R0 gate, so MD is the limit of the cold cut on my bot’s traffic.
Fewer layers. On 2026-11-13, I ranked the layers by Block Influence and healed each cut with a linear map. A whole layer of the MD prune holds 1.39 to 1.51 GiB, so two layers would have brought the load to about 67 GiB. But no whole layer, no half layer and no pair of layers passed the replay gate. The heal map removed 61% of the cost of one FFN half (layer 24), and even that was not enough.
The biggest lessons
- Read the rules of your own tools. A rule from a public data set protected 2.27 GiB of experts that my bot almost never used. Only the weight share of each kept expert showed it.
- Repeat a close result. A limit that sits inside the noise of one run gives a random answer. For a small cut, I now compare the mean of two replays, each against an R0 from the same window.
- Count the memory of the fix. The plain fix for 15 counts would have used 18.7 GiB to free 4.29 GiB. Check the memory of a patch before the downtime, not during it.
Thanks for reading! If you have any questions or suggestions, feel free to reach out.
My code is in this repo: czhou578/spark-moe-specialize. The new tools of this post are cold_sets.py, the --drop-file option of mask_checkpoint.py, the per-layer prune_experts.py, and the loader patch image-patch/per-layer-experts.diff. The repo also holds the window scripts (cold_replay.sh, loader_window.sh), the kernel check (loader_kernel_check.py) and the deploy script (deploy_md.sh).
The eval harness (the replay screen, the speed tests, the full runs and the LLM judge) is in my bot’s repo, which is private.
CZ